Fit quality, contact time, and phosphorus capture.
Biochar may help capture phosphorus before it reaches waterways. This study asks which published capacity estimates warrant further testing, while keeping the recipe, fit quality, uncertainty, and signs of phosphorus release attached to each result.
The result in plain English
The largest reported capacity was also an unreliable fit under the study’s rule. Of 36 poultry-litter biochar formulations, 16 have numeric capacity estimates with R² greater than 0.80. Eight numeric fits are excluded and 12 carry the source’s net-release label. The shortlist identifies candidates for follow-up; it is not a ranking of proven field treatments.
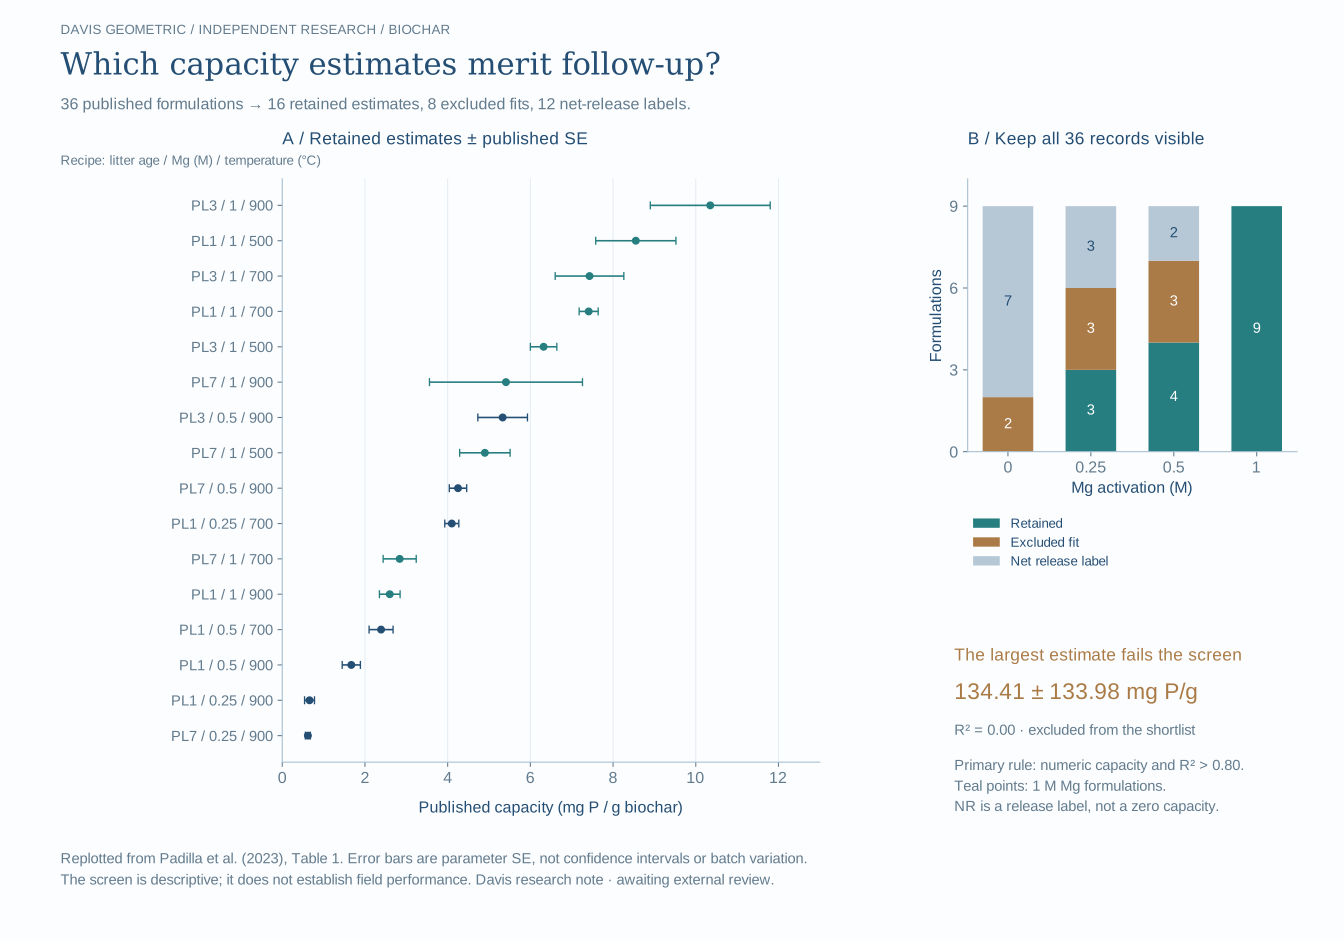
What stays attached to a capacity estimate?
The source recipe includes poultry-litter age (PL1, PL3 or PL7), Mg activation concentration, and pyrolysis temperature. The highest retained point estimate is PL3 / 1 M Mg / 900 °C: 10.35 ± 1.45 mg P/g, R² = 0.90. The uncertainty is the published parameter standard error. It does not measure between-batch variation, and the point ordering is not a significance test.
The capacity-only maximum is 134.41 ± 133.98 mg P/g with R² = 0.00. It stays in the inventory, even though it fails the screen. A missing capacity marked NR remains missing; it is never replaced by zero.
| Strict R² threshold | Retained / 36 | Leading formulation ID | Leading capacity (mg P/g) |
|---|---|---|---|
| > 0.70 | 17 | 24 | 10.35 |
| > 0.80 | 16 | 24 | 10.35 |
| > 0.85 | 14 | 24 | 10.35 |
| > 0.90 | 12 | 10 | 8.55 |
| > 0.95 | 5 | 11 | 7.41 |
GIGI’s role: preserve context and make the screen inspectable
GIGI stores formulation records and executes filtering, sorting, and aggregation. The repository records checks of the returned rows and rankings against an independent Python reference. The researcher chooses the fit-quality rule; the database applies it and keeps its inputs traceable.
This study demonstrates evidence handling. Conventional databases can perform the same screen; it does not compare database performance or validate geometric learning. Statistical uncertainty remains the source SE or SD, separate from any geometric confidence metadata.
Look past the fitted summaries
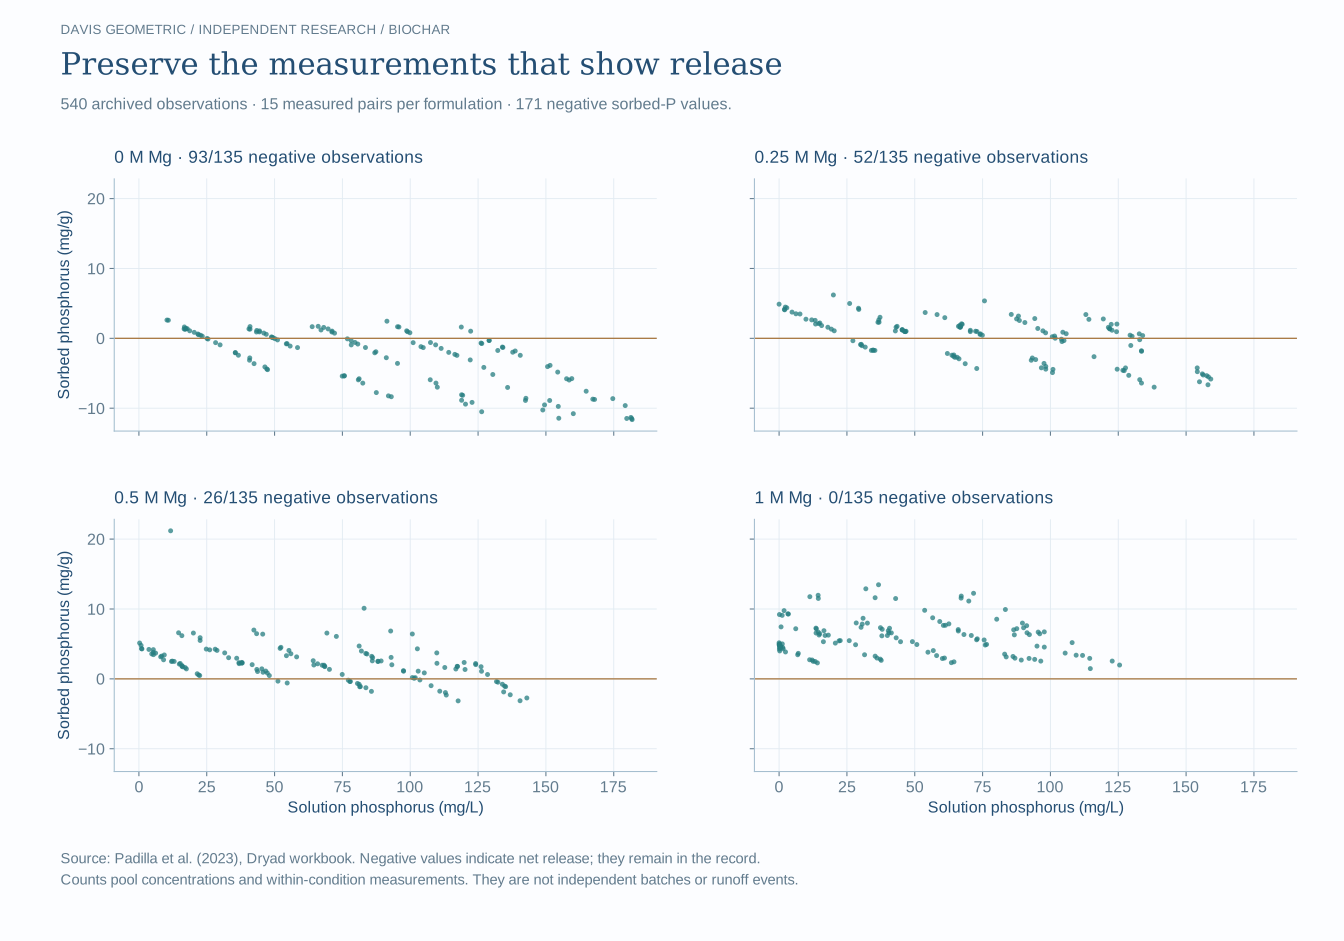
The archived workbook contains 540 signed isotherm observations. In 171, sorbed phosphorus is negative: the material is releasing phosphorus under that measurement condition. The counts below retain the source’s concentrations and observations; they do not estimate a field failure probability.
A separate question: how long is the contact?
The Wang (2021) dataset contains 72 means with reported standard deviations across six materials and twelve times. The follow-up compares each sampled-time ranking and 54 target/SD scenarios. Its materials and experimental context are separate from the Padilla formulation screen.
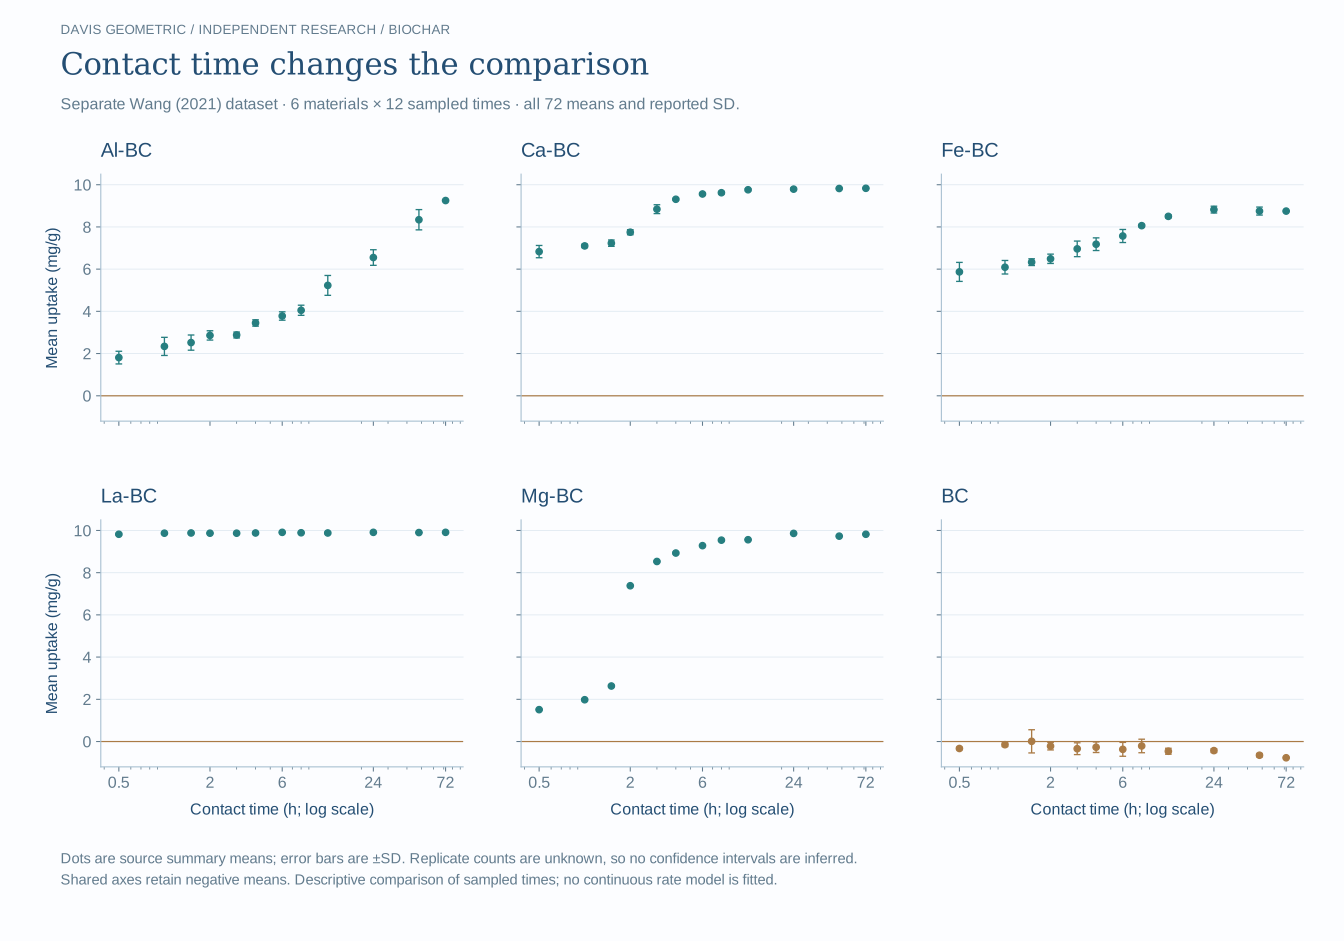
These comparisons do not interpolate an exact breakthrough time or infer confidence intervals from an unknown replicate count. The source observations support comparisons at the sampled times.
What should be tested next?
The paper proposes an upflow-column experiment with realistic water chemistry, controlled flow, and repeated exposures. Measure both inlet and outlet phosphorus loads, include blanks and control materials, and test subsequent release. Capturing phosphorus once does not establish that it remains captured.
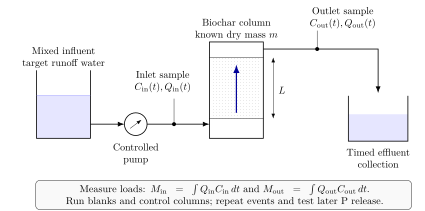
Column dimensions, flow rate, sampling schedule and replication remain choices for the future experiment. The paper reports secondary analysis of existing studies, not new laboratory or farm-runoff results.
Paper, data, and source record
Research setting: Independent. The note is being prepared for scientific discussion and awaits external review.
- Bee Rosa Davis (2026), Fit Quality Screening of Biochar for Phosphorus Capture. Research note; no publication DOI assigned.
- Padilla et al. (2023), Magnesium activation affects the properties and phosphate sorption capacity of poultry litter biochar. Table 1, CC BY 4.0; values normalized and replotted here.
- Padilla et al. Dryad workbook, CC0. All 540 isotherm observations retained.
- Wang (2021) Dryad data, CC0. Separate contact-time dataset; associated article A comparative study on phosphate removal from water using Phragmites australis biochars loaded with different metal oxides.