PageRank / inspect iterations and residuals together
Research settingIndependent
This line of work proposes using graph geometry to help choose an iterative solver. The relevant distinction is between describing a graph’s mixing behavior and reducing the total cost of computing its PageRank vector.
From the research record
Inspect the work
Original figures, recorded values, and explicit model details. Each exhibit identifies its source and what the comparison means.
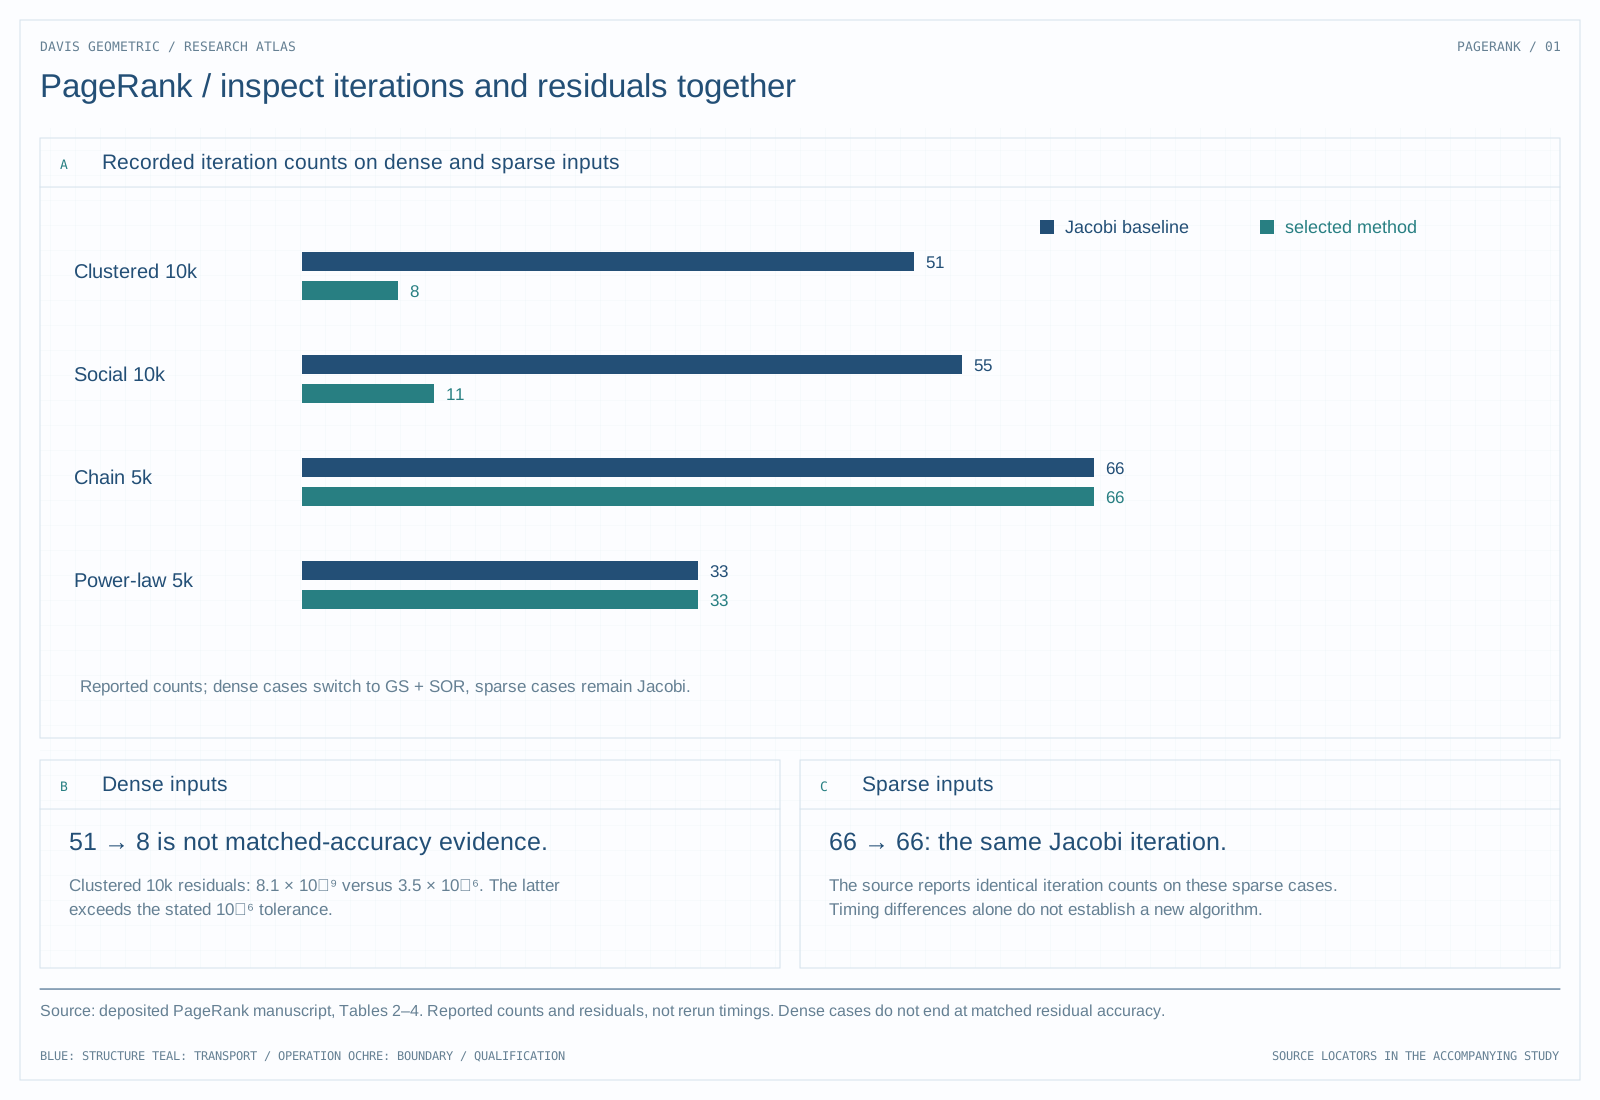
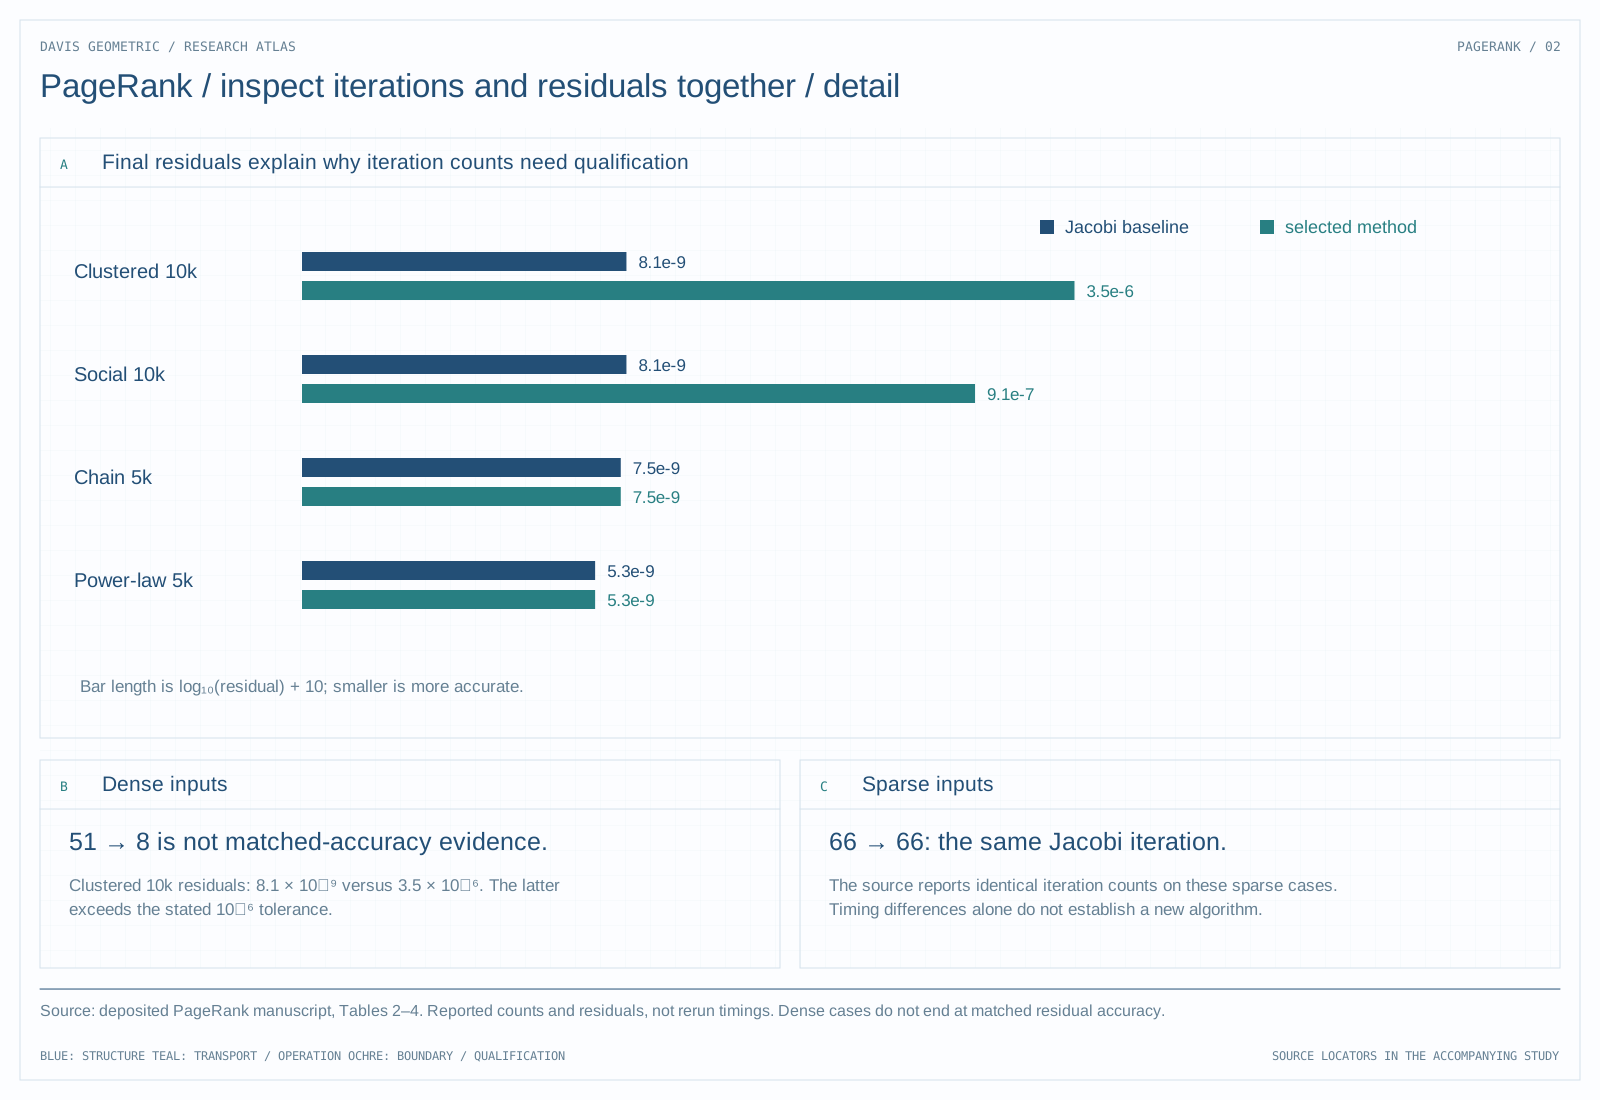
Iteration counts with the final residuals beside them
Scroll horizontally to inspect the full table →
| Graph / size | Jacobi iterations | Selected method iterations | Jacobi residual | Selected method residual |
|---|---|---|---|---|
| Clustered / 10,000 | 51 | 8 | 8.1 × 10⁻⁹ | 3.5 × 10⁻⁶ |
| Social / 10,000 | 55 | 11 | 8.1 × 10⁻⁹ | 9.1 × 10⁻⁷ |
| Chain / 5,000 | 66 | 66 | 7.5 × 10⁻⁹ | 7.5 × 10⁻⁹ |
| Power-law / 5,000 | 33 | 33 | 5.3 × 10⁻⁹ | 5.3 × 10⁻⁹ |
Joined by graph and size from Tables 2–4. Dense cases use Gauss–Seidel with SOR; sparse cases use Jacobi in both arms. Dense iteration savings are not a comparison at matched residual. The clustered residual 3.5 × 10⁻⁶ also exceeds the manuscript’s stated 10⁻⁶ threshold, contrary to its nearby prose. Counts are manuscript-reported, not rerun.
Read the technical figure
Source: deposited PageRank manuscript, Tables 2–4. Reported counts and residuals, not rerun timings. Dense cases do not end at matched residual accuracy.
Source: deposited PageRank manuscript, Tables 2–4. Reported counts and residuals, not rerun timings. Dense cases do not end at matched residual accuracy.
Supporting detail
What the proposed diagnostic is meant to change
The catalog describes a Davis Manifold treatment of PageRank with curvature-driven solver selection. PageRank repeatedly propagates probability through a graph while adding a damping-dependent restart term. A structural diagnostic would be useful here if it predicted which available iteration scheme reaches a specified residual at the lowest total cost.
The diagnostic is itself computation. Constructing a neighborhood graph, estimating a spectrum, or computing a curvature proxy can cost more than the iterations saved. The object of the research is therefore the combined diagnostic-and-solve procedure, not a geometric score considered in isolation.
What is preserved from the manuscript record
The deposited paper selects Gauss–Seidel with SOR for dense graphs and Jacobi for sparse ones. Its tables report 51 versus 8 iterations on the 10,000-vertex clustered graph, but the final residuals differ: 8.1 × 10⁻⁹ for Jacobi and 3.5 × 10⁻⁶ for the selected method. The latter also exceeds the stated 10⁻⁶ threshold. The table above keeps both the savings and this discrepancy visible.
On the 5,000-vertex chain and power-law examples, both arms use Jacobi and have identical iteration counts. Those cases cannot support a new algorithmic acceleration claim. The source tables are reported evidence; the small probability-flow example below is a separate teaching construction.
Sources, scope, and next question
Deposited manuscript with reported iteration counts and residuals; the comparison has not been independently rerun.
Repeat the selection rule against fixed solvers at a common measured residual, including diagnostic and preprocessing time. That would distinguish the benefit of changing iteration schemes from differences in stopping accuracy.