The Geometry of War.
Economic ties can survive long after trust has broken down. This project asks how to represent that tension—and whether the structure of a relationship can make its stresses easier to examine.
From Helicity to Psychohistory to a book
The Geometry of War grew out of my Helicity project and my efforts to map the structure of the Navier–Stokes problem. That work led me to ask a different question: could ideas about flow, connection and changing structure help us examine relationships between countries?
The first paper, Psychohistory, caught the attention of Dr. Paolo Di Prodi. We worked together to refine the analysis tool, and I later developed the project into The Geometry of War—a book connecting the proposed framework, historical case studies and the mathematics behind the representation.
Collaboration described by Bee Rosa Davis. Di Prodi’s PhD at the University of Glasgow studied artificial societies and information theory; a 2026 publication lists his CrowdStrike affiliation. Research setting: CrowdStrike, as attributed by Bee Rosa Davis.
The question in plain English
Two countries may depend on each other for energy, trade or production while losing the diplomatic capacity to manage disagreement. Treating “strongly connected” as equivalent to “getting along” hides that distinction.
The model keeps those descriptions separate. It constructs an integration index, K, and a diplomatic-capacity index, τ, then examines how their relationship changes. These are operational definitions built from chosen inputs and weights; their names do not by themselves establish geometric or physical laws.

Three descriptions that should stay distinct
| Description | What it represents | Where to read |
|---|---|---|
| Legacy H = V × A | An empirical product of economic flux and diplomatic alignment. Negative values are possible. | Psychohistory v3; book Appendix B, Algorithm 5a |
| Later H = τ / (K + 0.01) | A ratio of diplomatic capacity to the integration index. With the stated nonnegative inputs, H is nonnegative. | Appendix B, Algorithm 5b |
| Network spectral gap | The second-smallest eigenvalue of the chosen weighted graph Laplacian. It depends on the graph and weight normalization. | Chapter 4 and Appendix B |
Version 3 also treats low-integration relationships separately. When K < 0.05, the model switches to security-posture, hostility and disconnection indicators. A country pair with little economic connection is not simply an extreme version of a highly interdependent pair.
A network calculation you can inspect
Chapter 4 uses three hypothetical countries with trade weights of 50, 30 and 20. Holding two connections fixed and reducing the third from 30 to 2 changes the graph’s spectrum. The diagram below uses the book’s inputs and recalculates both matrices.
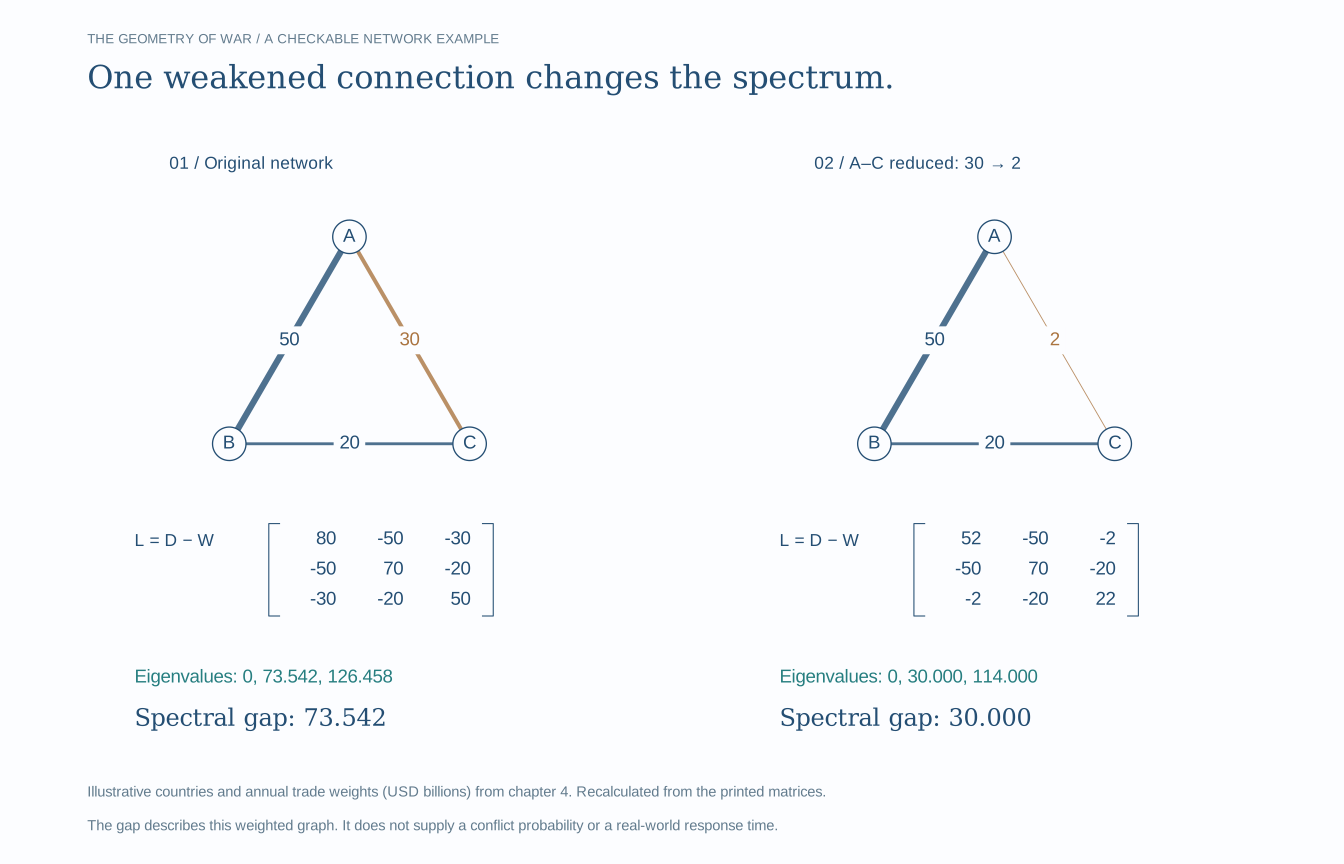
| A–C weight | Eigenvalues printed in the book | Recalculated from its matrix |
|---|---|---|
| 30 | 0, 39.2, 160.8 | 0, 73.542, 126.458 |
| 2 | 0, 10.4, 133.6 | 0, 30, 114 |
The checked gap falls by about 59.2%, rather than the printed 73%. For the stipulated graph-diffusion equation, a smaller gap means a slower-decaying nonconstant mode. Turning that statement into a claim about diplomacy requires a justified dynamics model and a calibrated timescale.
What the historical studies can—and cannot—establish
The paper and book discuss historical country pairs, retrospective alerts, missed cases and false positives. They are a record of the research and its proposed interpretation. This web study does not independently reproduce the reported forecasting scores or establish that an alert was issued prospectively.
A prospective test would freeze the inputs, their release dates and the alert rule, then evaluate all eligible country pairs over a declared horizon—including those that do not enter conflict. An analogy to fluid structure does not prove that war is inevitable or settle the Navier–Stokes problem.
Read the original work
The Geometry of War
436 PDF pages · Bee Rosa Davis · 2026. The book develops the ideas through the problem of war, the proposed framework, historical cases, mathematical foundations and limitations.
Choose a starting point
Source record
The paper and book PDFs are exact copies of the author-supplied files. Only the three-country matrix example was recalculated here. The contour figure evaluates the stated ratio at illustrative inputs; it contains no historical observations.