Shortest paths: inspect the comparisons
Research settingIndependent
A timing ratio is meaningful only beside its baseline, input, and measurement protocol. This study page exposes the recorded cases behind the overview.
01 / Identify the comparison
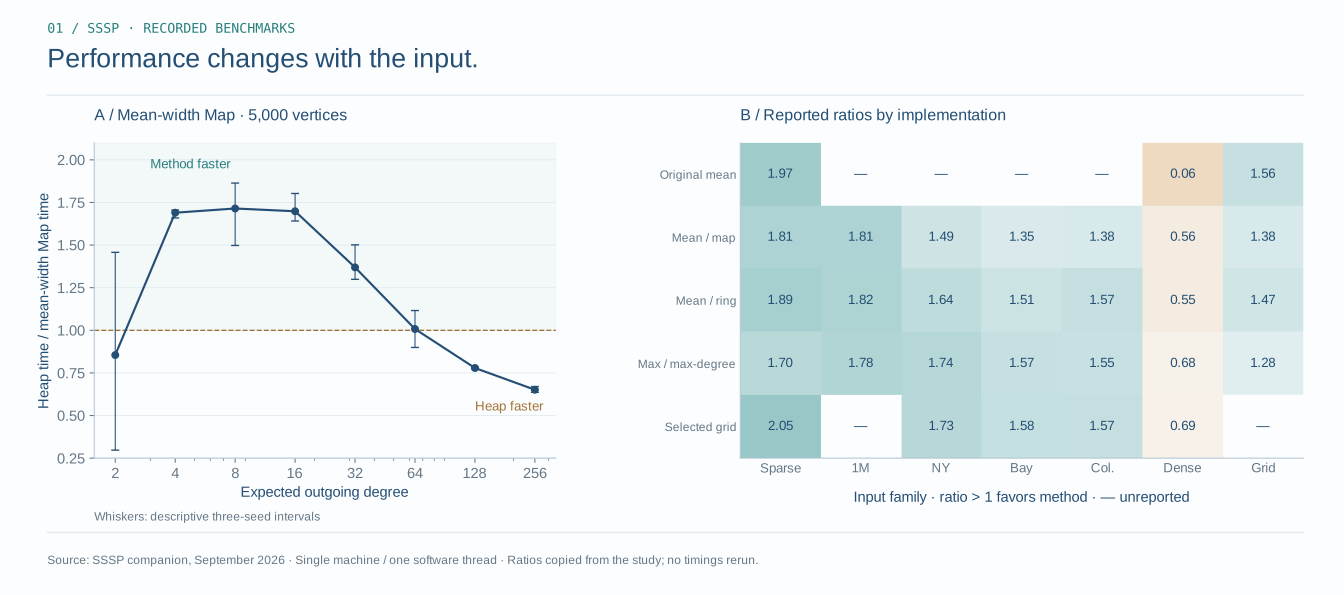
The denominator is the selected method’s solve time; the numerator is the study’s standard binary-heap baseline time. A ratio above one favors the method, a ratio below one favors the heap. The baseline and competitors are study-specific implementations. Ratios can aggregate paired measurements and need not equal a ratio of the displayed median times.
02 / Inspect the density sweep
| Expected degree | Ratio | Recorded low | Recorded high |
|---|---|---|---|
| 2 | 0.854857 | 0.297143 | 1.45741 |
| 4 | 1.68984 | 1.65933 | 1.70557 |
| 8 | 1.71464 | 1.49765 | 1.86391 |
| 16 | 1.69837 | 1.64124 | 1.80261 |
| 32 | 1.36907 | 1.29895 | 1.50138 |
| 64 | 1.00761 | 0.899148 | 1.11607 |
| 128 | 0.778834 | 0.774022 | 0.784253 |
| 256 | 0.65117 | 0.636045 | 0.670183 |
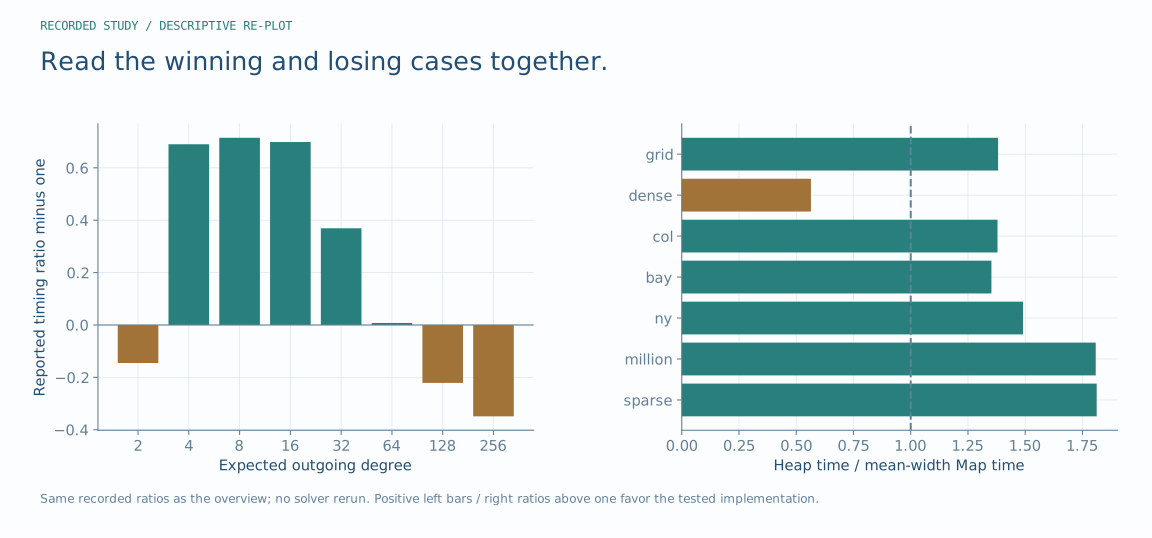
The sign and size of the result vary with density. An uncertainty interval crossing one does not support a clear ranking from that summary alone. These intervals describe the tested seeds; they are not population-wide performance guarantees.
03 / Compare every recorded implementation
| Input | Vertices | Arm | Median time (ms) | Reported ratio |
|---|---|---|---|---|
| Sparse network | 10000 | std_binary | 2.37818 | 1 |
| Sparse network | 10000 | original_mean | 1.21365 | 1.97087 |
| Sparse network | 10000 | mean_map | 1.33888 | 1.81218 |
| Sparse network | 10000 | mean_ring | 1.27697 | 1.89396 |
| Sparse network | 10000 | max_maxdegree | 1.42 | 1.69986 |
| Sparse network | 10000 | selected_grid | 1.17952 | 2.04776 |
| A million places | 1000000 | std_binary | 796.943 | 1 |
| A million places | 1000000 | mean_map | 449.358 | 1.8079 |
| A million places | 1000000 | mean_ring | 445.235 | 1.81656 |
| A million places | 1000000 | max_maxdegree | 447.286 | 1.78475 |
| New York roads | 264346 | std_binary | 51.6215 | 1 |
| New York roads | 264346 | mean_map | 34.1446 | 1.49056 |
| New York roads | 264346 | mean_ring | 31.2877 | 1.64372 |
| New York roads | 264346 | max_maxdegree | 29.6818 | 1.73675 |
| New York roads | 264346 | selected_grid | 29.7172 | 1.72806 |
| Bay Area roads | 321270 | std_binary | 54.7886 | 1 |
| Bay Area roads | 321270 | mean_map | 41.3093 | 1.35243 |
| Bay Area roads | 321270 | mean_ring | 36.5142 | 1.50513 |
| Bay Area roads | 321270 | max_maxdegree | 35.4483 | 1.56701 |
| Bay Area roads | 321270 | selected_grid | 35.0177 | 1.57901 |
| Colorado roads | 435666 | std_binary | 77.7513 | 1 |
| Colorado roads | 435666 | mean_map | 55.9933 | 1.37902 |
| Colorado roads | 435666 | mean_ring | 48.9149 | 1.56878 |
| Colorado roads | 435666 | max_maxdegree | 50.5222 | 1.55004 |
| Colorado roads | 435666 | selected_grid | 49.1161 | 1.57403 |
| A densely connected network | 5000 | std_binary | 9.3033 | 1 |
| A densely connected network | 5000 | original_mean | 146.659 | 0.0632398 |
| A densely connected network | 5000 | mean_map | 16.6253 | 0.564187 |
| A densely connected network | 5000 | mean_ring | 16.9907 | 0.549562 |
| A densely connected network | 5000 | max_maxdegree | 13.7184 | 0.68066 |
| A densely connected network | 5000 | selected_grid | 13.52 | 0.693903 |
| A grid network | 10000 | std_binary | 1.18942 | 1 |
| A grid network | 10000 | original_mean | 0.773225 | 1.56421 |
| A grid network | 10000 | mean_map | 0.87245 | 1.38155 |
| A grid network | 10000 | mean_ring | 0.814375 | 1.46637 |
| A grid network | 10000 | max_maxdegree | 0.927425 | 1.28317 |
04 / Read the mechanism separately from speed
Duplicate suppression, bucket width, and local lookahead change different kinds of work. Reducing one counter is not the same as reducing wall time: scans, queue operations, preparation, and input layout also matter. The companion reports negative lookahead results alongside faster and slower timing cases.
The recorded study is sequential, on one machine, with study-specific inputs and correctness checks. This page replots the saved summaries; it has not rerun the solvers. The companion links the paper, artifact, measurement definitions, and seed-level aggregates.
Sources, versions & further reading
Additional diagnostic plates are analytic constructions or descriptive re-plots of the saved record, as labeled. They do not introduce new experimental validation.