Plasma geometry & spectral diagnostics
Research settingIndependent
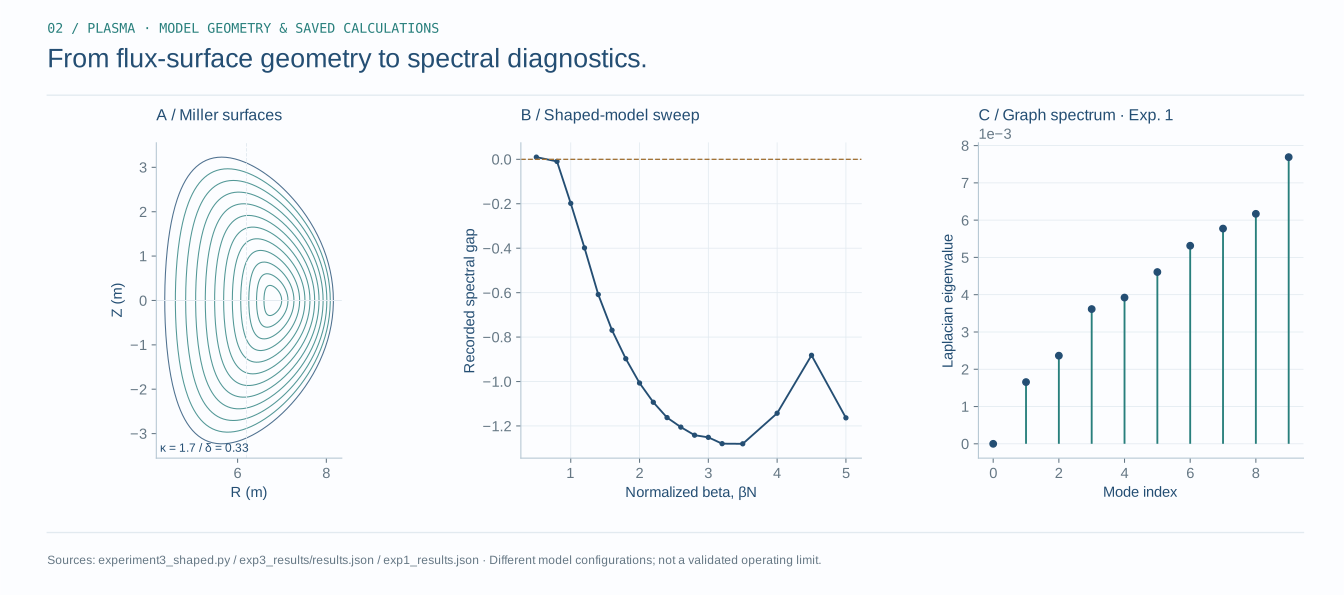
Read the geometric reconstruction separately from the saved parameter sweep and graph spectrum. The panels describe different mathematical objects.
01 / Separate the three objects
The flux-surface drawing is reconstructed from a stated Miller parameterization. The beta sweep is saved output from a shaped model. The graph eigenvalues come from the separate Experiment 1 configuration. Their placement on one plate makes them readable together, not mutually validating measurements of one physical system.
02 / Read the construction
Z = 1.7 × 2r sin θ
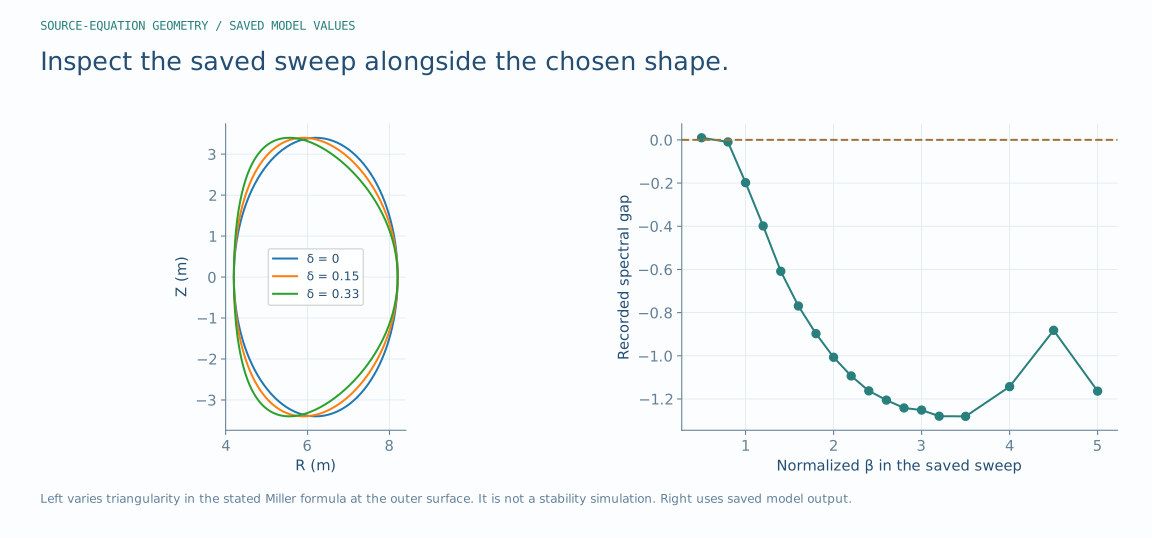
The nested contours use a normalized radial parameter r. Elongation stretches the vertical coordinate; triangularity changes the angular shape. The displayed curves implement the source equations, without running a plasma equilibrium or transport solver. The supplemental outer-surface comparison holds elongation fixed and varies triangularity explicitly.
03 / Inspect the saved values
| Normalized beta | Spectral gap | Worst radial location | Recorded stable flag |
|---|---|---|---|
| 0.5 | 0.00982254 | 0.05 | True |
| 0.8 | -0.00949071 | 0.834615 | False |
| 1 | -0.198168 | 0.857692 | False |
| 1.2 | -0.398591 | 0.857692 | False |
| 1.4 | -0.608436 | 0.880769 | False |
| 1.6 | -0.769188 | 0.880769 | False |
| 1.8 | -0.897392 | 0.880769 | False |
| 2 | -1.00674 | 0.880769 | False |
| 2.2 | -1.09322 | 0.880769 | False |
| 2.4 | -1.16235 | 0.903846 | False |
| 2.6 | -1.2052 | 0.903846 | False |
| 2.8 | -1.24151 | 0.926923 | False |
| 3 | -1.25124 | 0.926923 | False |
| 3.2 | -1.27969 | 0.95 | False |
| 3.5 | -1.28036 | 0.95 | False |
| 4 | -1.14274 | 0.95 | False |
| 4.5 | -0.881999 | 0.880769 | False |
| 5 | -1.16357 | 0.880769 | False |
04 / Interpretation boundary
A sign change in this operator’s spectral gap is a property of this model and discretization. Interpreting it as a physical operating boundary would require the derivation, numerical convergence, parameter sensitivity, and validation appropriate to that claim. No experimentally validated confinement limit follows from this plate alone.
Sources, versions & further reading
Additional diagnostic plates are analytic constructions or descriptive re-plots of the saved record, as labeled. They do not introduce new experimental validation.