Power networks: topology to spectrum
Inspect the network diagram, the effective and classical spectra, and their residual differences. Agreement in this fixture has a precise, limited meaning.
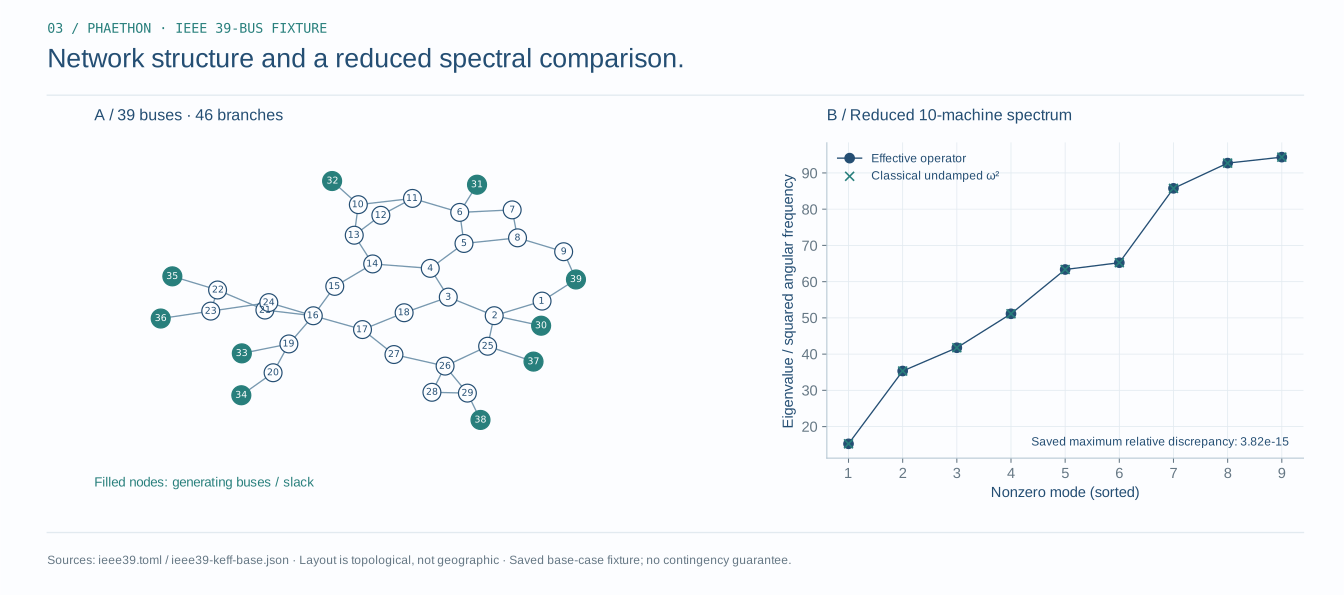
01 / Keep topology and layout distinct
The graph includes the 39 buses and source branches of the fixture. Its placement is a visualization layout, not the geographic positions of a utility network. Generating buses are identified separately. A drawing crossing does not create a bus; only the source incidence list defines connectivity.
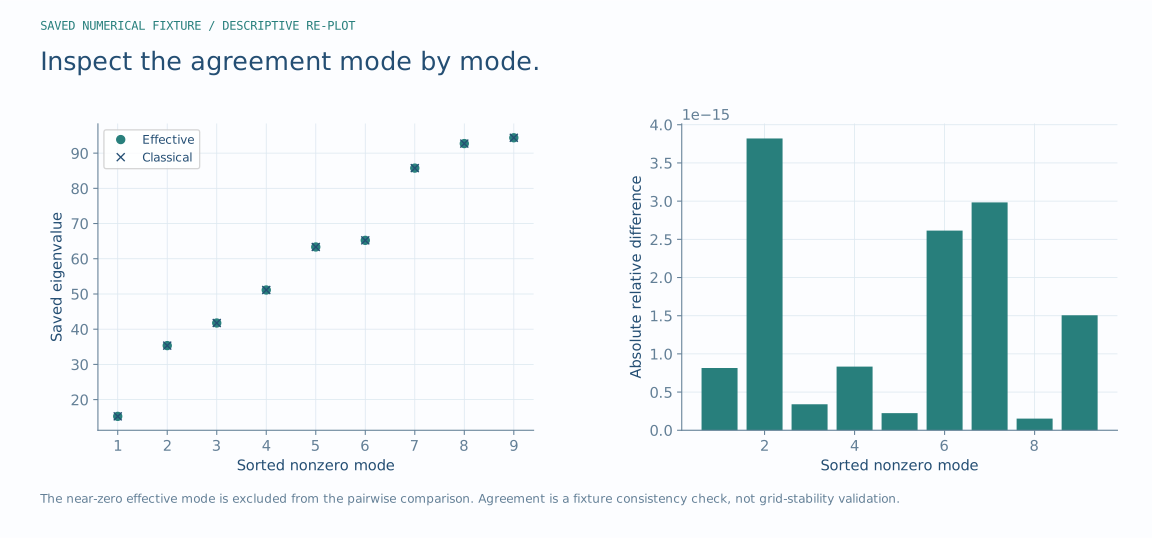
02 / Inspect the operator comparison
| Mode | Effective operator | Classical undamped |
|---|---|---|
| 1 | 15.2428 | 15.2428 |
| 2 | 35.3347 | 35.3347 |
| 3 | 41.7562 | 41.7562 |
| 4 | 51.1287 | 51.1287 |
| 5 | 63.3485 | 63.3485 |
| 6 | 65.2293 | 65.2293 |
| 7 | 85.7455 | 85.7455 |
| 8 | 92.7142 | 92.7142 |
| 9 | 94.3606 | 94.3606 |
The comparison excludes the near-zero effective mode. Pairing sorted spectra checks this saved base-case relationship, rather than proving eigenvector agreement, behavior under every operating point, or robustness to disturbances.
03 / Read the scope of agreement
The reported fixture agreement is a numerical consistency check between specified operators. Grid stability also depends on the operating point, dynamics, damping, controls, limits, and disturbances. This plate does not certify a grid, dispatch policy, or controller. The representative paper explains the proposed domain-specific evaluation.
Sources, versions & further reading
Additional diagnostic plates are analytic constructions or descriptive re-plots of the saved record, as labeled. They do not introduce new experimental validation.