Probability lift: inspect both conditionals
Keep the joint probability and both marginals visible. The symmetry is algebraic; the conditional populations are different.
01 / Work through the construction
Start here / a worked example
A change from 20% to 40% has a lift of two.
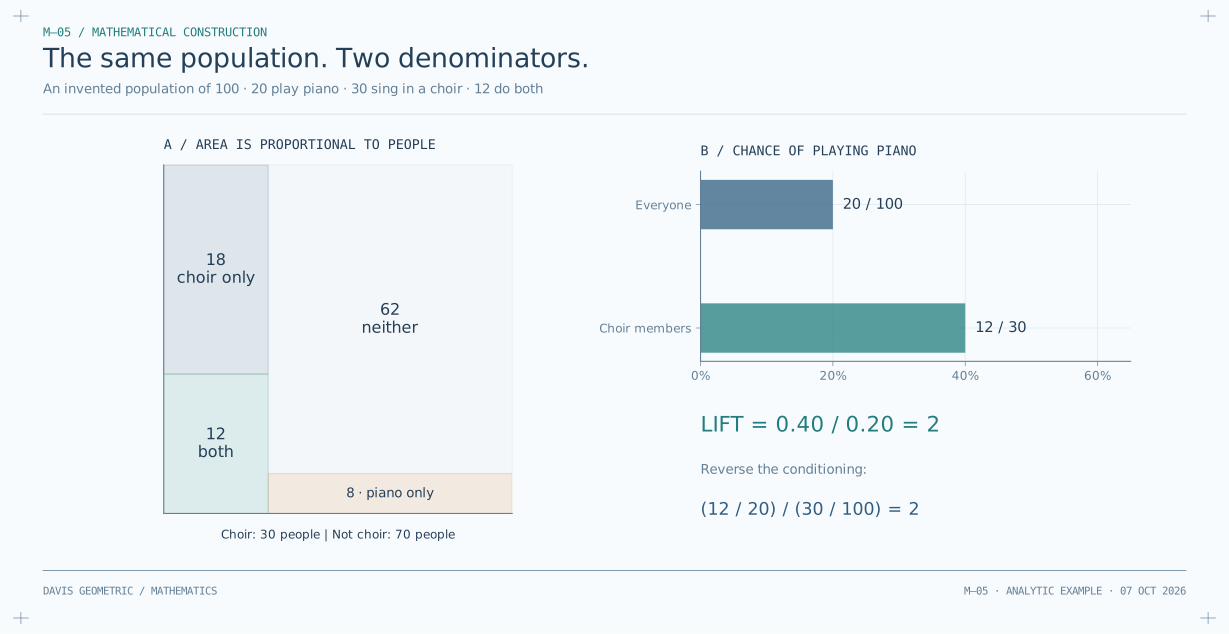
Count a small, explicitly invented population.
Imagine 100 people. Twenty play piano; thirty sing in a choir; twelve do both. The numbers here are a teaching example, not study data.
Change the group you are counting within.
Across everyone, the probability of playing piano is 20/100 = 20%. Among the thirty choir members, it is 12/30 = 40%. Conditioning changes the denominator because it changes the group under consideration.
Recover the symmetric formula.
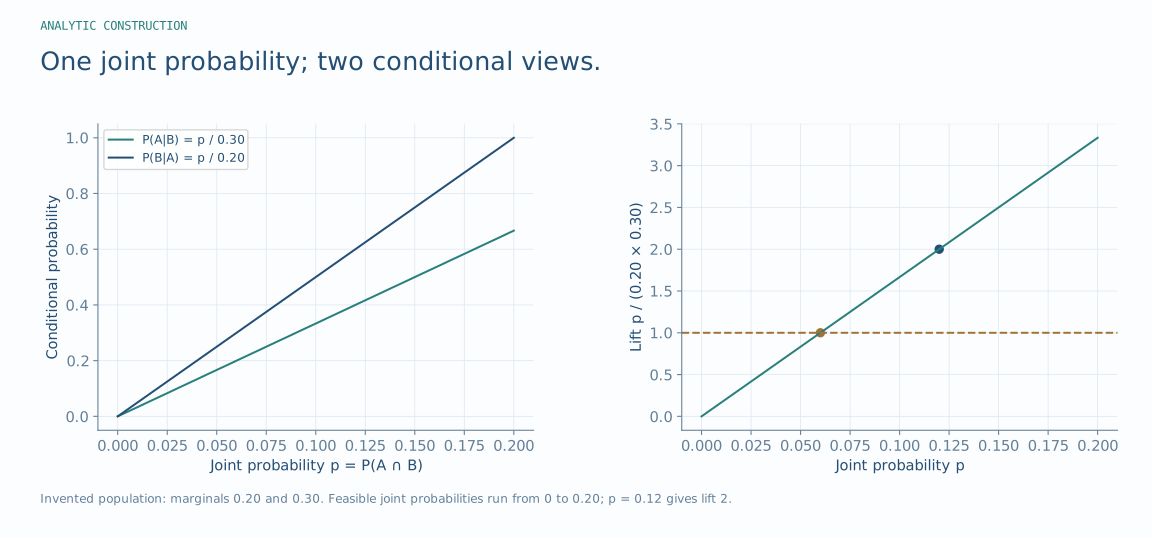
Write A for playing piano and B for singing in the choir. Then the joint probability is 0.12 and the marginal probabilities are 0.20 and 0.30. Their ratio is 0.12/(0.20 × 0.30) = 2. Reversing the question gives 12/20 = 60% compared with the 30% choir baseline: again a factor of two.
This is an exact probability identity. It records association; it does not establish causation or supply a geometric curvature model.
Words for this step Event / marginal probability · Conditional probability, P(A|B) · Lift, Λ · Independence
02 / A complementary view
03 / What to check when applying the idea
Identify the state space, the equivalence rule, the distance or observable, and the assumptions used by the argument. Then ask which part is an identity, which part is a model choice, and which part needs an empirical test. The worked constructions illustrate the stated mathematics; they are not evidence that every dataset admits the same geometry.
Use the linked proof review to distinguish the retained conditional statements from the broader manuscript claims requiring correction. Original manuscript titles identify sources and do not override the narrower conclusions on the current research pages.
Sources, versions & further reading
Additional diagnostic plates are analytic constructions or descriptive re-plots of the saved record, as labeled. They do not introduce new experimental validation.