Life sciences / GEODESIC / PARALLAX
GEODESIC in oncology: from mutation profiles to questions about evolution
The oncology GEODESIC project studies representations of mutation profiles and clonal structure. This is a different project from the GEODESIC retrieval and indexing work elsewhere in the catalog.
Research settingIndependent
TL;DR
In brief
The question
What can representations built from tumour mutation records distinguish in retrospective cancer datasets, and which of those distinctions need a different cohort to test?
What the work does
The work builds GEODESIC's cancer-evolution tool inside PARALLAX: a mutation-profile encoder and pipeline that accept VCF or MAF variant files and return clonal-architecture and trajectory output with a PDF report.
What is still open
Whether any retrospective separation transfers to screening or treatment response is untested; that needs patient-level splits, a non-cancer cohort and prospective assessment.
Available recordCancer-analysis platform and study inventory; cohort analysis is not screening validation.
From the research record
Inspect the work
Original figures, recorded values, and explicit model details. Each exhibit identifies its source and what the comparison means.
The TCGA study’s reported results
Scroll horizontally to inspect the full table →
| Measurement | Reported value | What it measures |
|---|---|---|
| Samples / cancer types | 10,967 / 32 | TCGA cohort represented in the manuscript |
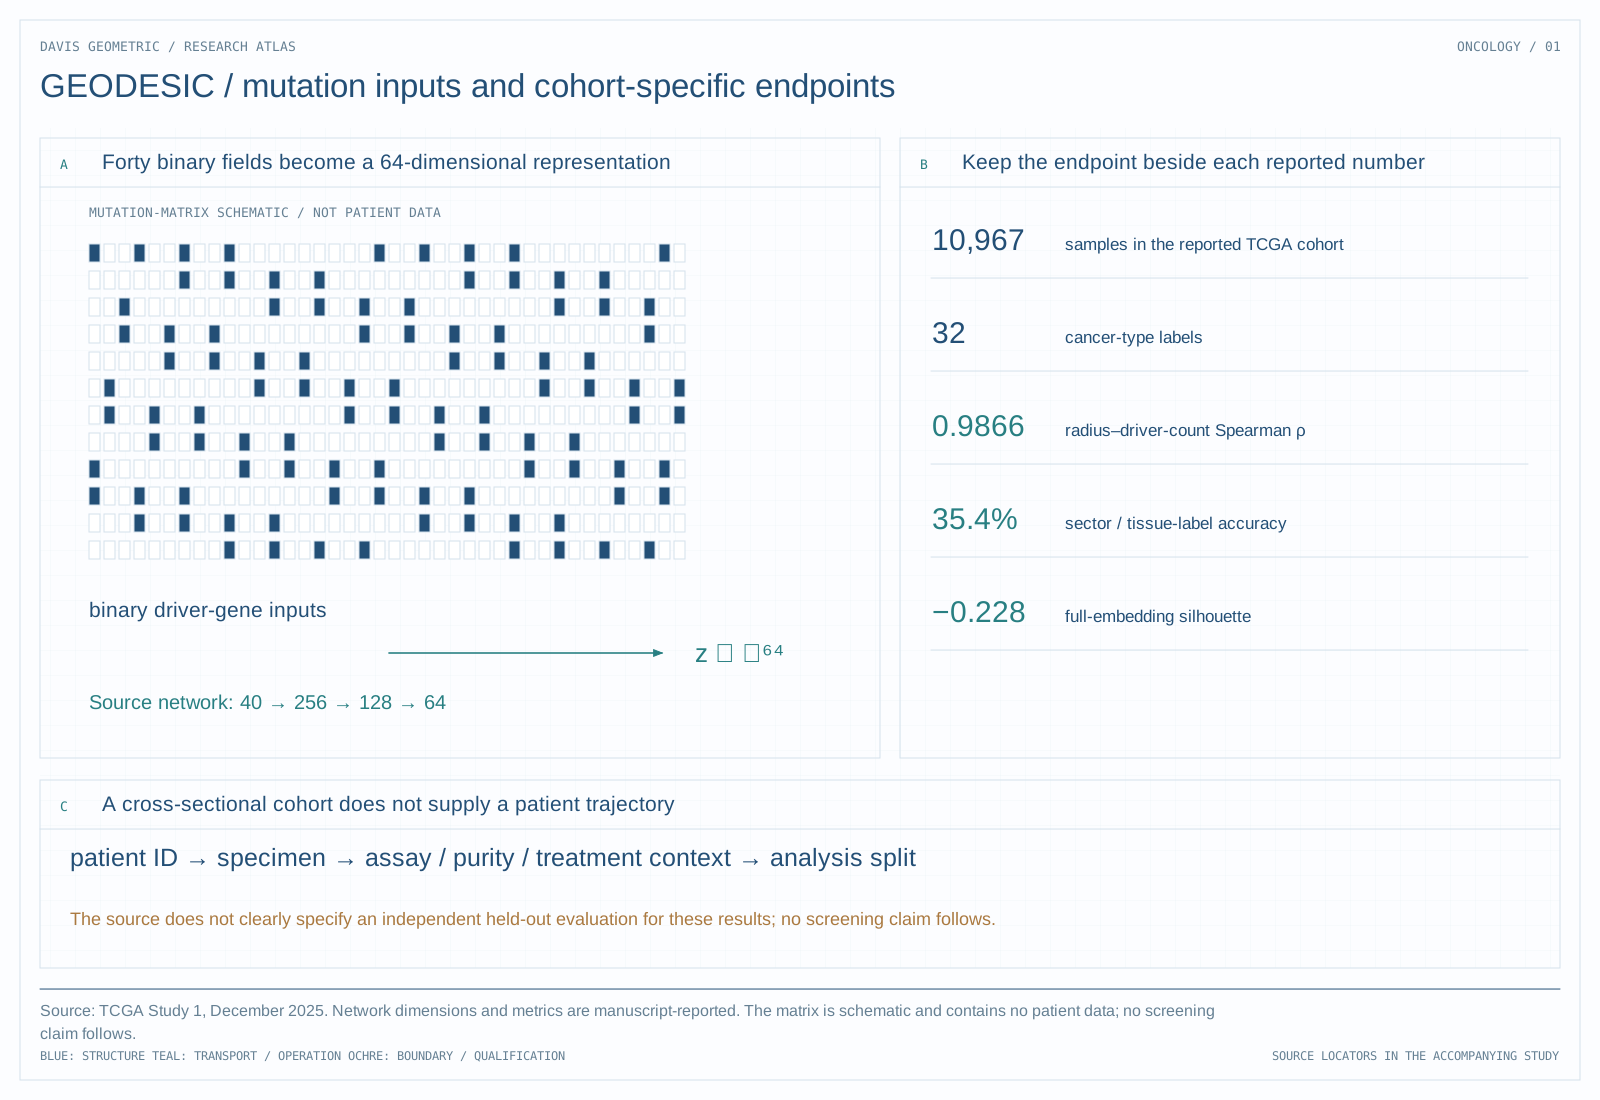
| Input / embedding | 40 binary driver-gene fields / 64 dimensions | Specified encoder representation |
| Radius–driver correlation | Spearman ρ = 0.9866 | Association with driver count in the analyzed representation |
| Sector accuracy | 35.4% | Tissue-label classification in this study |
| Sector margin | 0.791 | Minimum distance between cancer-type centroids |
| Full-embedding silhouette | −0.228 | Euclidean cluster separation diagnostic |
Transcribed from Study 1, not independently reproduced. The report does not clearly document an independent held-out evaluation for these results. Driver-count correlation is not validation of a malignancy score. Its separate infinite configuration-margin entry is not presented as successful benign/cancer discrimination because the comparison population is not established.
GEODESIC_Validation_Study_1__Real_TCGA_PanCancer_Atlas_Data_Analysis (1).pdf · 5 December 2025; Tables 2, 4 and 6, PDF pages 4–6
The research in context
A tumour is a population, not a single object: subclones carrying different mutations expand and contract under treatment. Sequencing yields variant calls, a list of positions where a sample differs from the reference, usually from a single biopsy. From that, researchers try to infer which mutations arose early, which subclones now dominate, and what the tumour may do next. The difficulty is a mismatch of kind: the quantities of interest are historical and within-patient, while the available data are largely cross-sectional and across patients, and tumour purity, sequencing depth, sampling site and prior treatment all shift the apparent picture. Separating biological pattern from procedural artefact is the central problem.
The oncology tool is the GEODESIC component of PARALLAX, the genomic analysis service the project deploys on Modal's serverless GPU containers. It is the only one of the three tools that takes variant-level input: the README's format table routes VCF and MAF files to GEODESIC and FASTA to the viral and bacterial tools. It has a dedicated mutation-profile encoder and pipeline module, reaches the same gateway and per-tool endpoints as the others, and returns a JSON result together with a generated PDF report. The README presents the tool as mapping tumour evolution from mutation analysis and as predicting treatment response from clonal architecture; those are stated capabilities of the deployment, with no accompanying study.
There is a gap between the service and the claims that would matter clinically. The platform analyses one submitted file per request and returns a report; survival association, primary-versus-metastatic comparison and early detection are cohort-level endpoints with different designs, which the service itself does not implement. The README's configuration listing gives a 64-dimensional latent dimension and a trajectory-confidence setting of 0.6; both are defaults in a source file, and the 0.6 in particular is a reporting threshold rather than a calibrated probability. Any cohort-level number must come from the separate study material, named with its cohort and endpoint.
What is represented
PARALLAX describes a cancer-evolution tool accepting VCF or MAF mutation records. Its proposed outputs concern tumor evolution and clonal architecture. The research question is whether a representation preserves relationships among mutations and samples that are useful for a specified biological endpoint.
A geometric trajectory can organize samples, but a trajectory inferred from a cross-sectional cohort is not automatically an observed within-patient history. Sampling time, treatment, sequencing coverage, and tumor purity can change the apparent path.
Keep the endpoint attached to each study
The reviewed inventory identifies TCGA, survival, and clonal-hematopoiesis study material. The December 2025 TCGA Study 1 reports 10,967 samples, 32 cancer types, a 40-field input and a 64-dimensional embedding. Its results table is reproduced above with the endpoint attached to each number. The report does not clearly specify an independent held-out evaluation for those results.
A representative result must therefore name its cohort and endpoint before presenting a number. Patient-level independence, site and assay effects, and treatment history are necessary to interpret whether a geometric signal is biological or procedural.
The next research step
The next publication-level account should select one existing study, identify its exact cohort and analysis version, and retain its endpoint and exclusions. The wider program can remain visible without combining distinct studies into a claim of integrated cancer detection.
Background mathematics and definitions
Specify patient-level inputs, the target endpoint, and cohort inclusion rules. Keep cancer-type classification, metastatic status, survival association, and early detection in separate protocols. Retain assay batch, site, and treatment metadata as potential sources of confounding.
- Evaluation unit
- A patient or another explicitly justified independent unit.
- Confounding
- A recorded or unrecorded factor associated with both inputs and outcomes.
- Screening population
- The intended population, including appropriate non-cancer comparators.
Illustrative example
If samples from hospital A are mostly one cancer type and hospital B mostly another, a model may learn site differences. A random specimen split can preserve that shortcut in both sets. Holding out a site asks a harder and more relevant transfer question.
This background example is separate from the source records and the main technical figure.
Source record
Additional source versions reviewed
-
parallax/README.mdLocal project manuscript or report · not republished here
No new experiments are reported in this research note. Figure captions distinguish saved research records, source-model calculations, and explanatory diagrams.