QI_B / Reference structure
Conventional fiber order
A symmetric 16-ply shell over uniform foam B. The half-stack is [0, +45, −45, 90, 0, +45, −45, 90], mirrored through the thickness.
GIGI / Helmet geometry study
Three shapes. Three layered structures. One question: which differences survive a closer calculation?
I compared helmet shapes and layered materials around the same assumed head, holding target material masses constant. An early numerical advantage changed under mesh refinement—when the same shapes were divided into smaller computational elements.
GIGI records and queries the designs, geometric descriptors and results. OpenCourant computes the mechanical response.

01 / The question
A spherical outer surface changes both contact geometry and the cushioning available at each point. Around a head that is not spherical, the same amount of foam becomes thinner in some places and thicker in others.
This experiment holds the covered head region and target material masses constant. It compares a head-following oval, a spherical cap and an oval that reallocates cushioning toward the crown and sides.
Research scope. This is an unvalidated computational screen. It does not establish a protective helmet, injury reduction or a safety rating.
02 / Geometry
Inspect the actual screening meshes and the local material directions. Changing the angle changes the direction marks, not the measured simulation results.
Actual screening mesh, shown at a common scale. Marks show the local ply material axis; they are not continuous manufactured fiber paths. Gold marks identify elements using the alternate coordinate chart. The face opening is visible; a facemask and chinstrap are not modeled.
Sections share the same scale; the front is to the right. Thicknesses and interfaces come from the model inputs. STL files use millimetres.
03 / Layer architecture
QI_B / Reference structure
A symmetric 16-ply shell over uniform foam B. The half-stack is [0, +45, −45, 90, 0, +45, −45, 90], mirrored through the thickness.
BAL_B / Isolate ply order
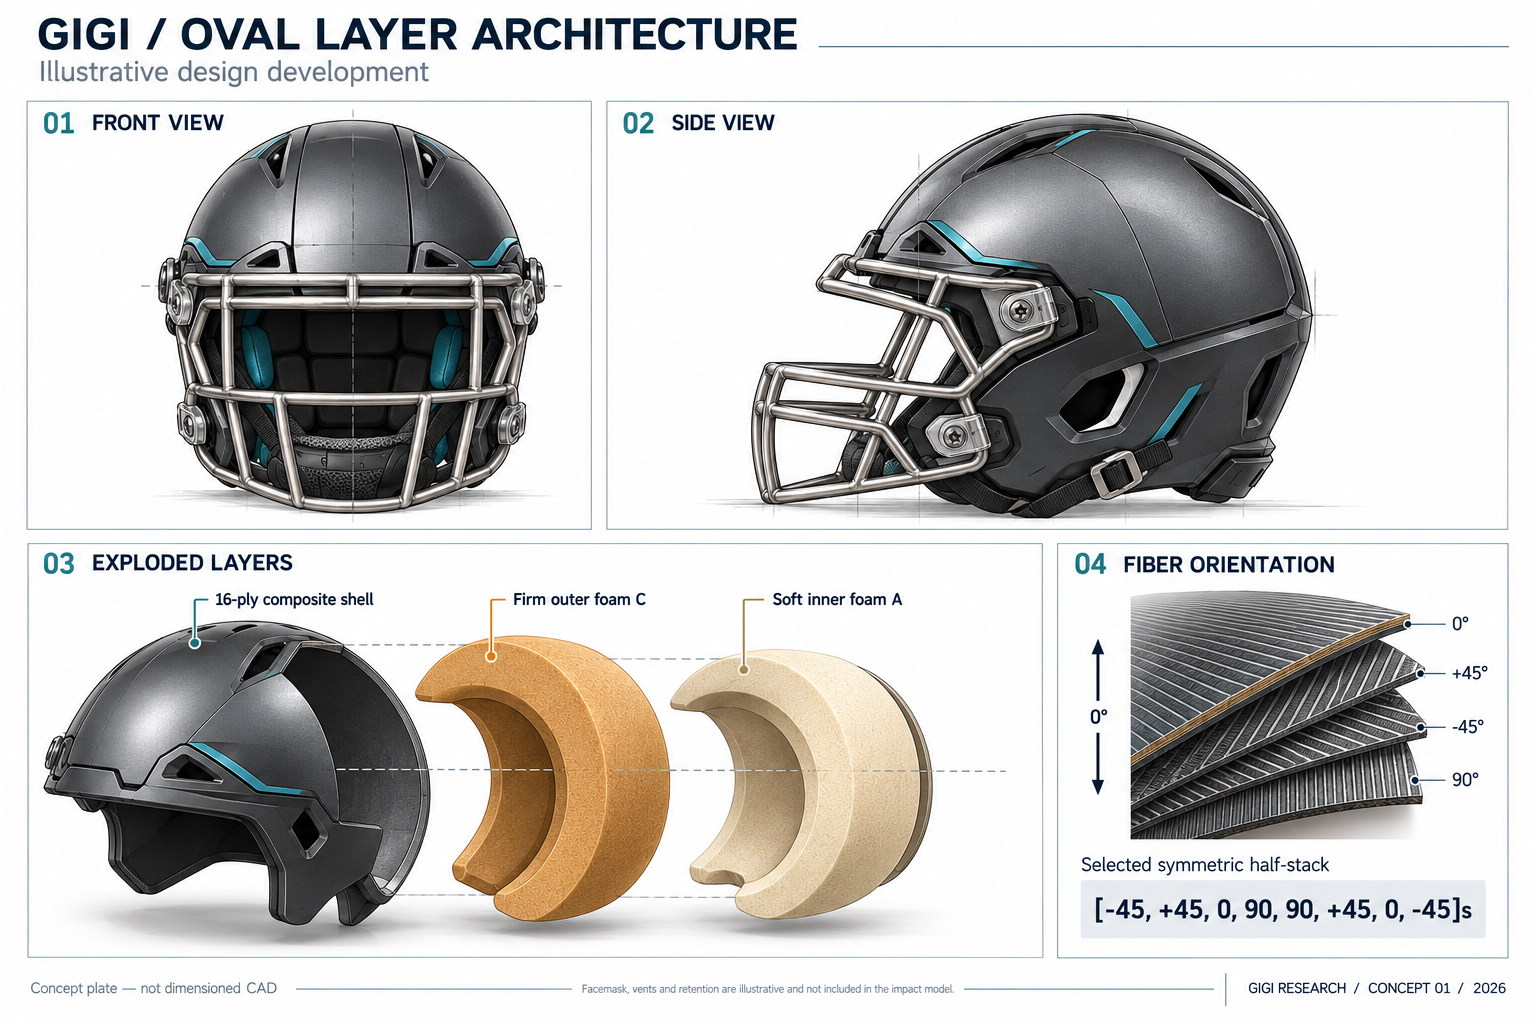
The selected half-stack is [−45, +45, 0, 90, 90, +45, 0, −45], mirrored. Angle counts and shell mass are unchanged.
BAL_AC / Change the liner
The selected shell covers soft A foam inside and firm C outside. A occupies 67.84% of liner volume; the interface is solved to match the uniform B liner’s mass.
Angles are local to the shell’s tangent plane. The 0° axis follows projected front-to-back direction, with an alternate coordinate chart near singular projections. These are material axes, not manufacturing paths.
04 / Impact in motion
The same oval, foam and oblique impact. Only the order of the 16 composite plies changes. Play the two simulations together, inspect a ply’s direction, or cut away the shell to see the cushioning.
This control changes the white direction marks only. Colors show the shell or liner response, not stress within the selected ply.
Loading recorded simulation frames…
For these two recorded runs, reordering the fibers changes the peak head-motion outputs only slightly.
Reordered (B) relative to conventional (A), on the same 32 × 10 mesh. Whole-run peaks; these numbers stay fixed during playback. Positive means a higher response. This pair does not establish an improvement in protection.
Colors show recorded shell stress or computed liner compression. White marks follow the selected ply’s local material axis as the shell deforms. Positions are shown at their actual scale; time is slowed down. The wall remains fixed.
In compression mode, each shell-sized patch shows the largest principal shortening through the four foam elements beneath it. A cutaway exposes the head and liner boundaries; the clipping surface is only a viewing aid.
OpenCourant · 32 × 10 surface mesh · four foam elements through thickness · recorded every 0.25 ms · 3 m/s normal + 3 m/s tangential · assumed friction 0.2. Frames are sampled directly, without invented intermediate load paths. These models omit the facemask and retention hardware shown in the concept renderings.
05 / Measured responses
The candidate’s oblique angular response is lower on one mesh, higher on the next, and close to baseline on the finest mesh tested.
A mesh divides the geometry into small elements so the solver can approximate its response. Refining that division should help us establish a stable comparison. Here, even the direction of the apparent advantage changes. No winning geometry is established.
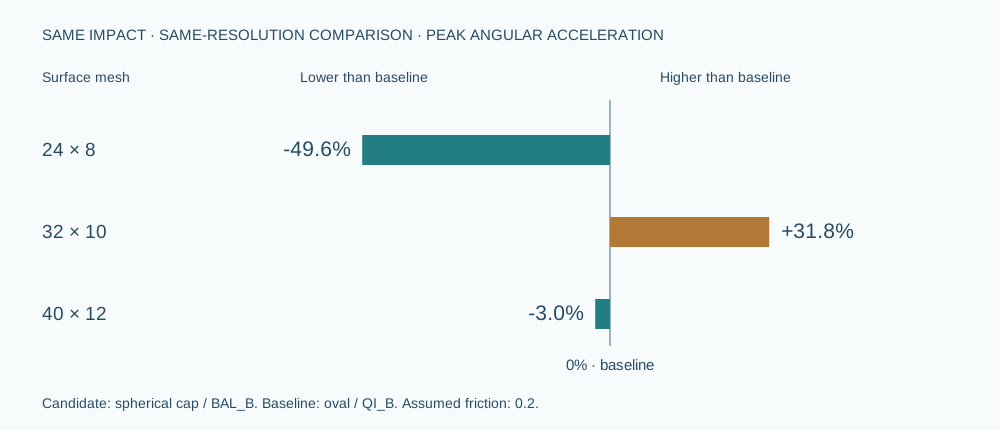
Candidate versus baseline: negative means lower response, positive means higher. This is one metric, not the overall score.
−49.6% angular acceleration
+31.8% angular acceleration
−3.0% angular acceleration
Oblique impact · spherical BAL_B versus oval QI_B · assumed friction 0.2 · four liner elements through thickness. The fine-mesh linear acceleration is 18.5% higher for the candidate. Read every paired comparison →
On the initial mesh, the spherical cap with reordered fibers had a minimax score 2.6% below baseline. That provisional ranking selected the candidate for further checks; it is not the study’s final conclusion.
| Shape / structure | Linear m/s² | Angular rad/s² | Spin rad/s | Relative score | Cases |
|---|
For each design, take the worst linear acceleration, angular acceleration and angular speed over the five impacts. Divide each by the corresponding worst baseline oval/QI_B metric. The score is the largest of those three ratios. Lower is better under this chosen numerical objective. The score is not an injury probability.
Only designs with all five cases passing the numerical gates enter the initial ranking. Mesh sensitivity is assessed separately.
06 / Impact histories
Compare a design with the baseline under the same impact. Longer frontal histories include restart extensions to finish contact.
Design exploration / Illustrative only
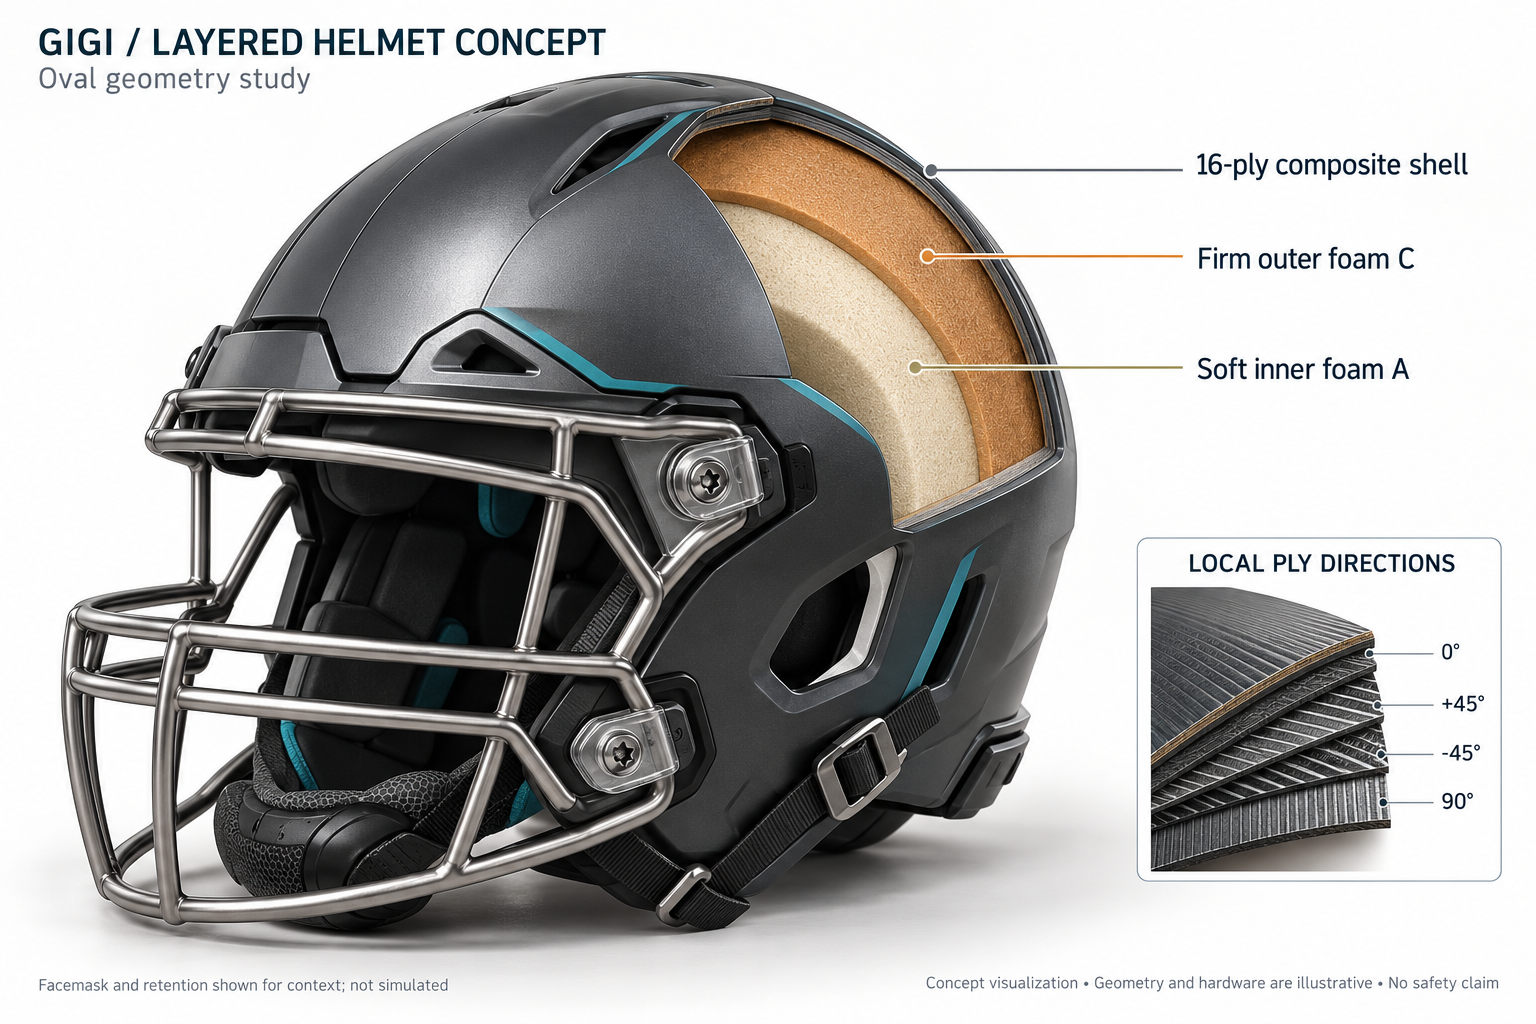
These AI-generated concept plates imagine a finished helmet. They include hardware, vents and cosmetic surfaces absent from the simulation. The model views above show the geometry actually tested.
07 / Evidence & reproduction
OpenCourant computes the mechanical response. GIGI stores and query-checks the input specifications, estimated surface curvature and measured solver summaries. Surface curvature here is a mesh geometry estimate, not GIGI’s statistical CURVATURE verb.