GEODESIC / mutation inputs and cohort-specific endpoints
Research settingIndependent
The oncology GEODESIC project studies representations of mutation profiles and clonal structure. This is a different project from the GEODESIC retrieval and indexing work elsewhere in the catalog.
From the research record
Inspect the work
Original figures, recorded values, and explicit model details. Each exhibit identifies its source and what the comparison means.
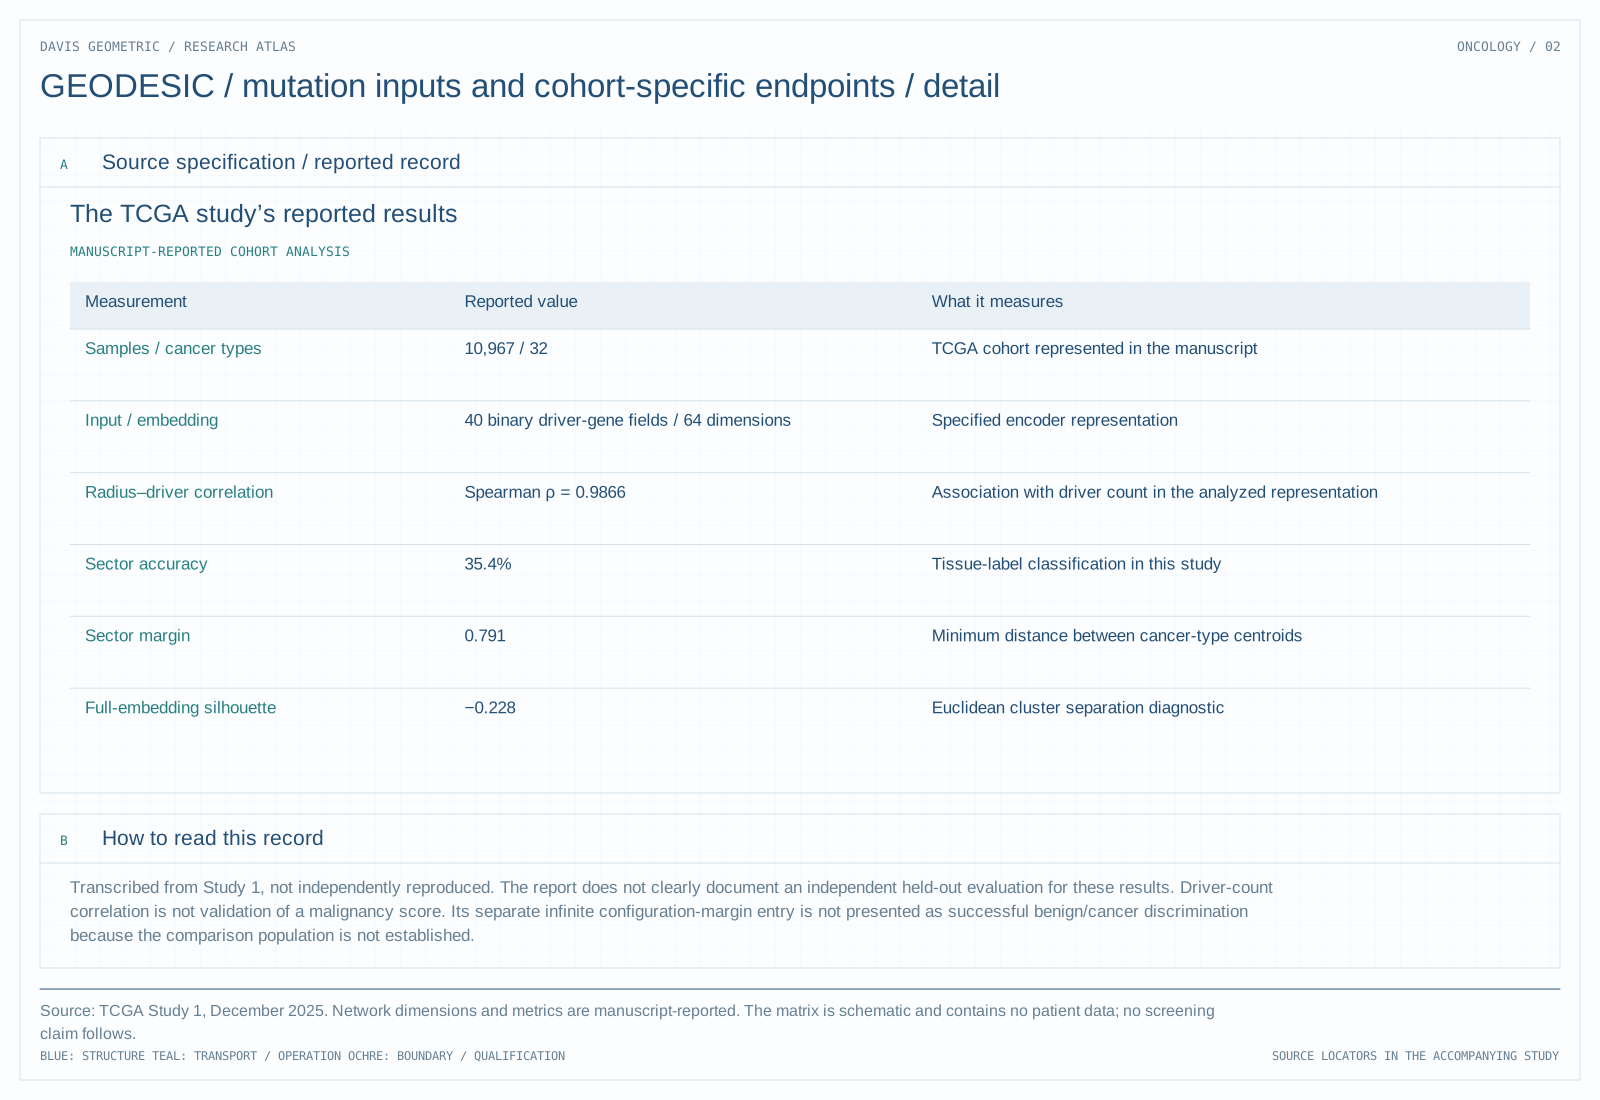
The TCGA study’s reported results
Scroll horizontally to inspect the full table →
| Measurement | Reported value | What it measures |
|---|---|---|
| Samples / cancer types | 10,967 / 32 | TCGA cohort represented in the manuscript |
| Input / embedding | 40 binary driver-gene fields / 64 dimensions | Specified encoder representation |
| Radius–driver correlation | Spearman ρ = 0.9866 | Association with driver count in the analyzed representation |
| Sector accuracy | 35.4% | Tissue-label classification in this study |
| Sector margin | 0.791 | Minimum distance between cancer-type centroids |
| Full-embedding silhouette | −0.228 | Euclidean cluster separation diagnostic |
Transcribed from Study 1, not independently reproduced. The report does not clearly document an independent held-out evaluation for these results. Driver-count correlation is not validation of a malignancy score. Its separate infinite configuration-margin entry is not presented as successful benign/cancer discrimination because the comparison population is not established.
GEODESIC_Validation_Study_1__Real_TCGA_PanCancer_Atlas_Data_Analysis (1).pdf · 5 December 2025; Tables 2, 4 and 6, PDF pages 4–6
Read the technical figure
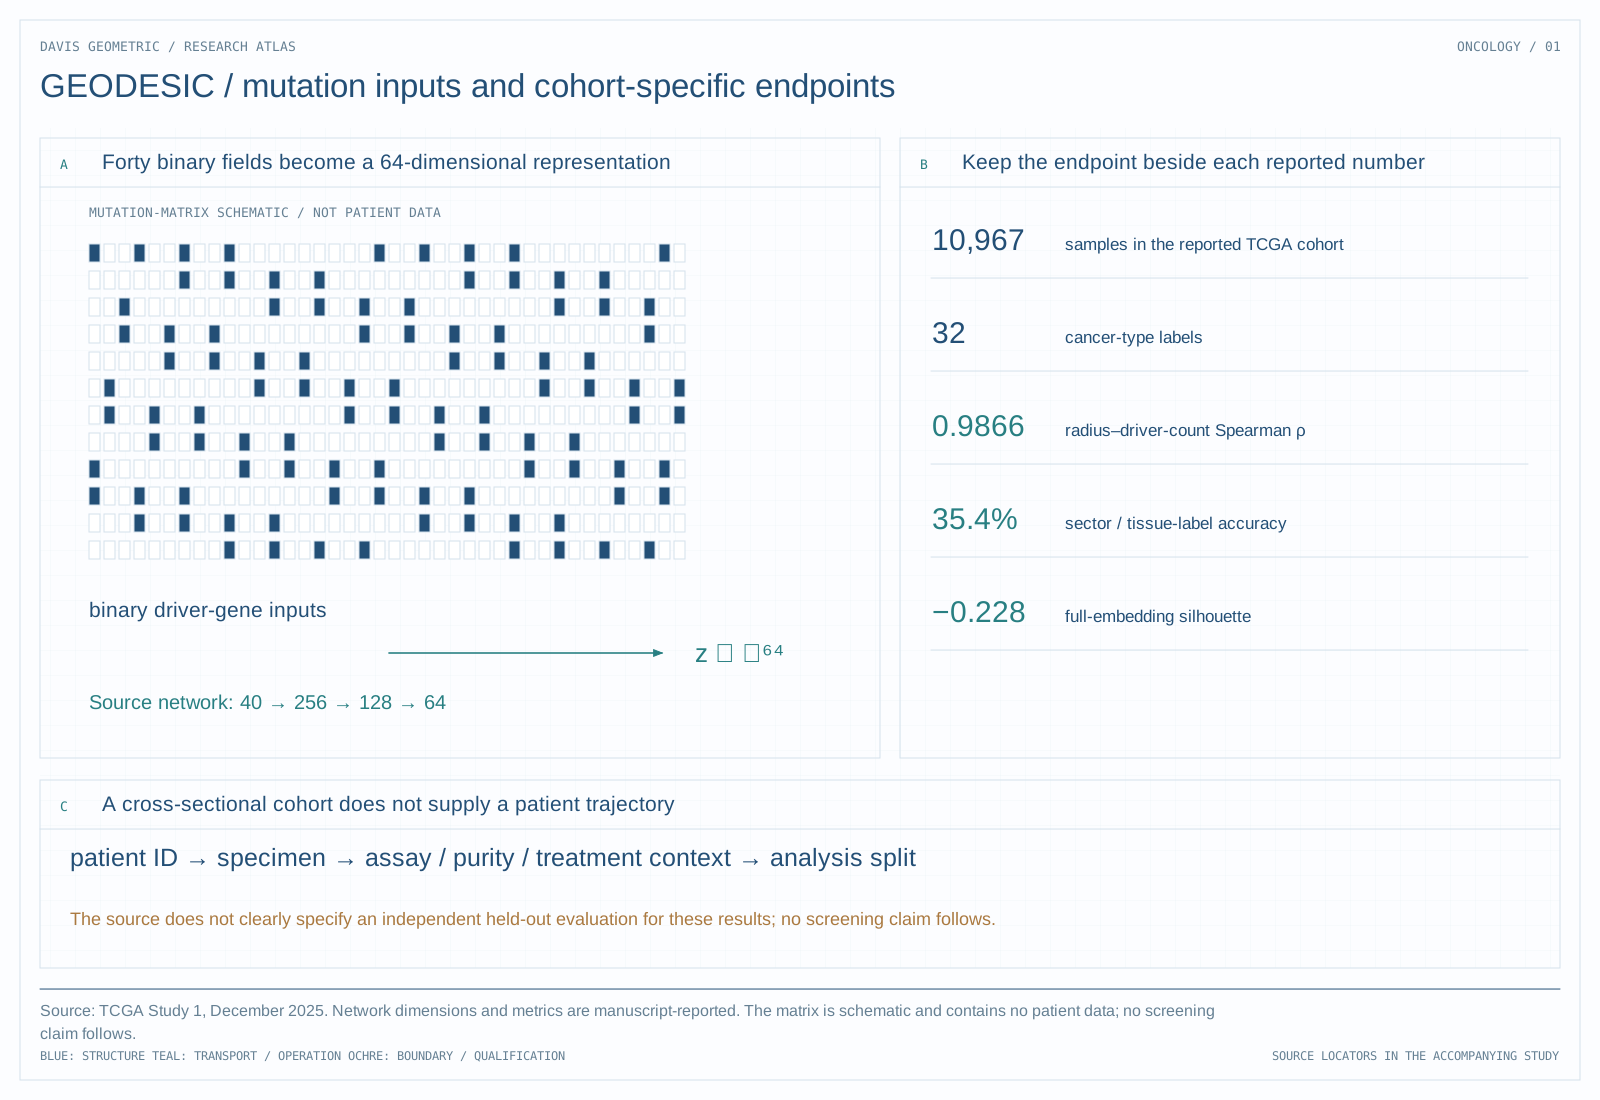
Source: TCGA Study 1, December 2025. Network dimensions and metrics are manuscript-reported. The matrix is schematic and contains no patient data; no screening claim follows.
Source: TCGA Study 1, December 2025. Network dimensions and metrics are manuscript-reported. The matrix is schematic and contains no patient data; no screening claim follows.
Supporting detail
What is represented
PARALLAX describes a cancer-evolution tool accepting VCF or MAF mutation records. Its proposed outputs concern tumor evolution and clonal architecture. The research question is whether a representation preserves relationships among mutations and samples that are useful for a specified biological endpoint.
A geometric trajectory can organize samples, but a trajectory inferred from a cross-sectional cohort is not automatically an observed within-patient history. Sampling time, treatment, sequencing coverage, and tumor purity can change the apparent path.
Keep the endpoint attached to each study
The reviewed inventory identifies TCGA, survival, and clonal-hematopoiesis study material. The December 2025 TCGA Study 1 reports 10,967 samples, 32 cancer types, a 40-field input and a 64-dimensional embedding. Its results table is reproduced above with the endpoint attached to each number. The report does not clearly specify an independent held-out evaluation for those results.
A representative result must therefore name its cohort and endpoint before presenting a number. Patient-level independence, site and assay effects, and treatment history are necessary to interpret whether a geometric signal is biological or procedural.
Sources, scope, and next question
Cancer-analysis platform and study inventory; cohort analysis is not screening validation.
The next publication-level account should select one existing study, identify its exact cohort and analysis version, and retain its endpoint and exclusions. The wider program can remain visible without combining distinct studies into a claim of integrated cancer detection.
Additional source versions reviewed
-
parallax/README.mdLocal project manuscript or report · not republished here