AMC · Changing the encoding →
If a telemetry vector changes, did the measured system change—or did its encoding? AMC adapts vector formats and tracks the translations between them so that distinction can be investigated.
Start with two familiar directions, then compare coordinate differences, wrapped angles, and distances in the circle embedding.
Start here / a worked example
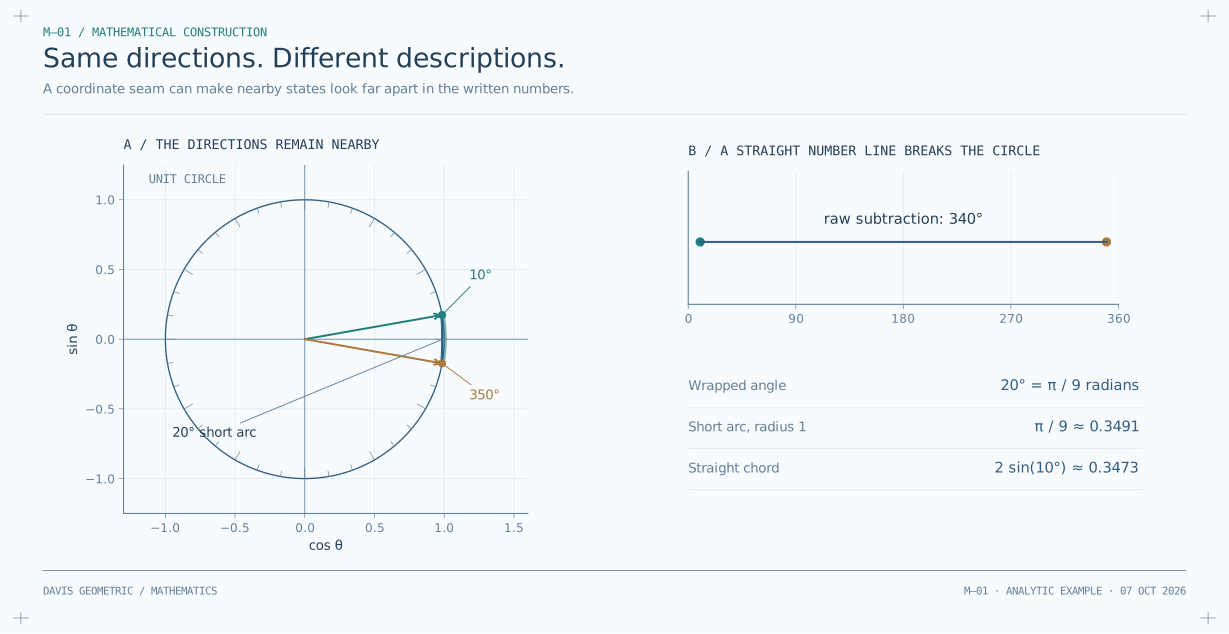
Two directions lie on either side of north: 350° and 10°. Subtracting the written numbers gives 340°. But the short turn from one direction to the other is only 20°.
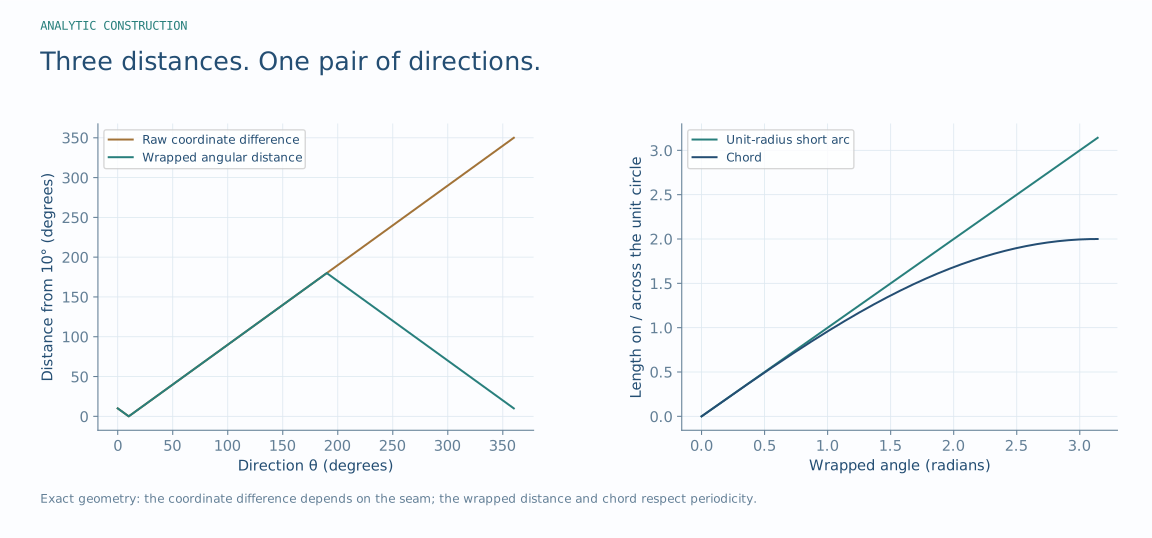
Put each direction on a unit circle using (cos θ, sin θ). Both points now sit near (1, 0). Their straight-line separation is about 0.347, while the short arc is about 0.349. Those are different measurements, but both retain the fact that the directions are close.
A representation should carry the relationships needed by the calculation. In this example that means respecting the wrap around at 360°. The research extends this question to translators between data formats and manifolds: under which assumptions do the two descriptions preserve identity, distance and decisions?
The circle is a concrete starting example. It does not prove that every dataset admits the required geometry.
Words for this step Equivalence · Metric · Distortion
Identify the state space, the equivalence rule, the distance or observable, and the assumptions used by the argument. Then ask which part is an identity, which part is a model choice, and which part needs an empirical test. The worked constructions illustrate the stated mathematics; they are not evidence that every dataset admits the same geometry.
Use the linked proof review to distinguish the retained conditional statements from the broader manuscript claims requiring correction. Original manuscript titles identify sources and do not override the narrower conclusions on the current research pages.
Additional diagnostic plates are analytic constructions or descriptive re-plots of the saved record, as labeled. They do not introduce new experimental validation.
From the construction to the work
The compass example asks what a change of description should preserve. These projects take that question into telemetry, payment records, databases and market measurements.
If a telemetry vector changes, did the measured system change—or did its encoding? AMC adapts vector formats and tracks the translations between them so that distinction can be investigated.
One payment can have different descriptions across financial message formats. PRISM separates translation from matching and retains the context needed to assess whether two records refer to the same transaction.
GIGI explores how a database can carry geometric structure alongside its records. The question moves from storing values to representing the relationships used to compare and transform them.
In a controlled replay, the trade events stay fixed while the numerical price scale changes. The classifier’s output changes too: a concrete reason to treat representation as part of a measurement, rather than a formatting choice.