Economic & social systems / HELICITY / LAMINAR
HELICITY / LAMINAR: measuring an order-flow coherence label
HELICITY is the broader market-analysis project. Within it, LAMINAR measures an order-flow coherence label across twelve futures instruments: how often the label appears, how it responds to controlled perturbations, and whether it persists when the surrounding context changes.
Research settingIndependent
HELICITY / Representative study · Working paper
LAMINAR: Measuring an Order-flow Coherence Label across Twelve Futures Instruments
LAMINAR is a study within HELICITY. It measures a classifier’s label; the broader project brings together macroeconomic, futures and order-book analysis.
Davis, Bee. LAMINAR: Measuring an Order-flow Coherence Label across Twelve Futures Instruments. September 9, 2026. SSRN. Abstract 7439319 · 10.2139/ssrn.7439319
Local edition: 13 pages, dated September 10, 2026 on the title page. The SSRN citation uses September 9. Version record & checksum
TL;DR
In brief
The question
Do graph-based measures of how money and orders circulate describe market conditions in ways that survive controlled perturbations and out-of-sample checks?
What the work does
A three-scale dashboard (macroeconomic series, futures bars, level-2 order book) and a measurement study of one order-flow label across 12 futures instruments, 194 sessions and surrogate controls.
What is still open
Whether the label carries market-specific information beyond its own thresholds, and any trading use after costs, latency and drawdowns, is untested on a frozen chronological holdout.
Available recordLAMINAR working paper on SSRN; historical replays and controlled comparisons within HELICITY. The study concerns classifier measurement, not predictive returns or execution performance.
From the research record
Inspect the work
Original figures, recorded values, and explicit model details. Each exhibit identifies its source and what the comparison means.
The classifier responds to surrogate inputs too
Scroll horizontally to inspect the full figure →
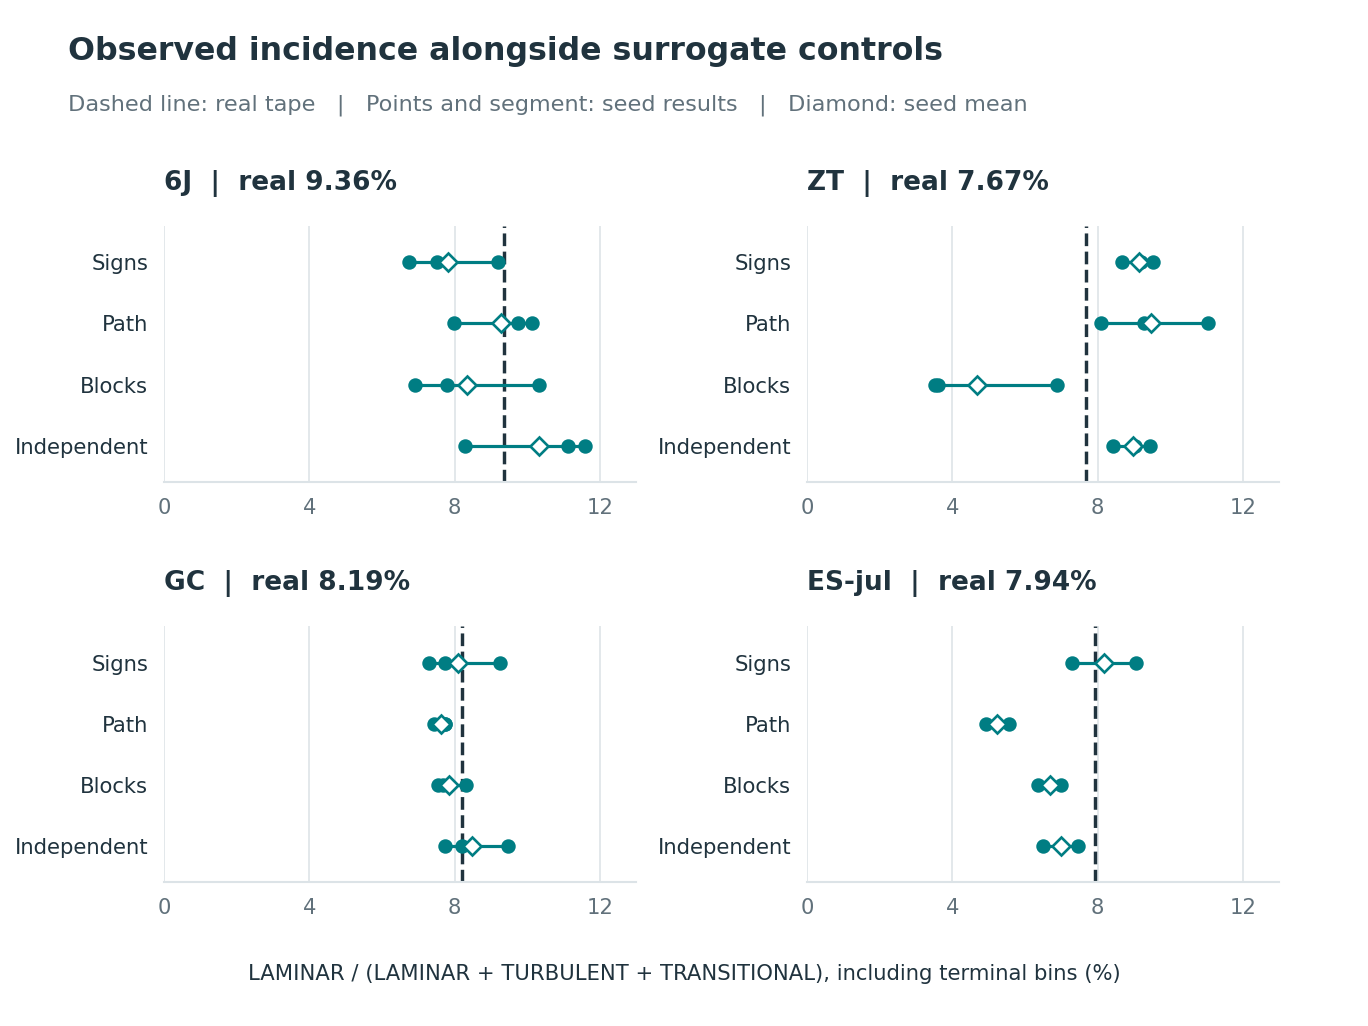
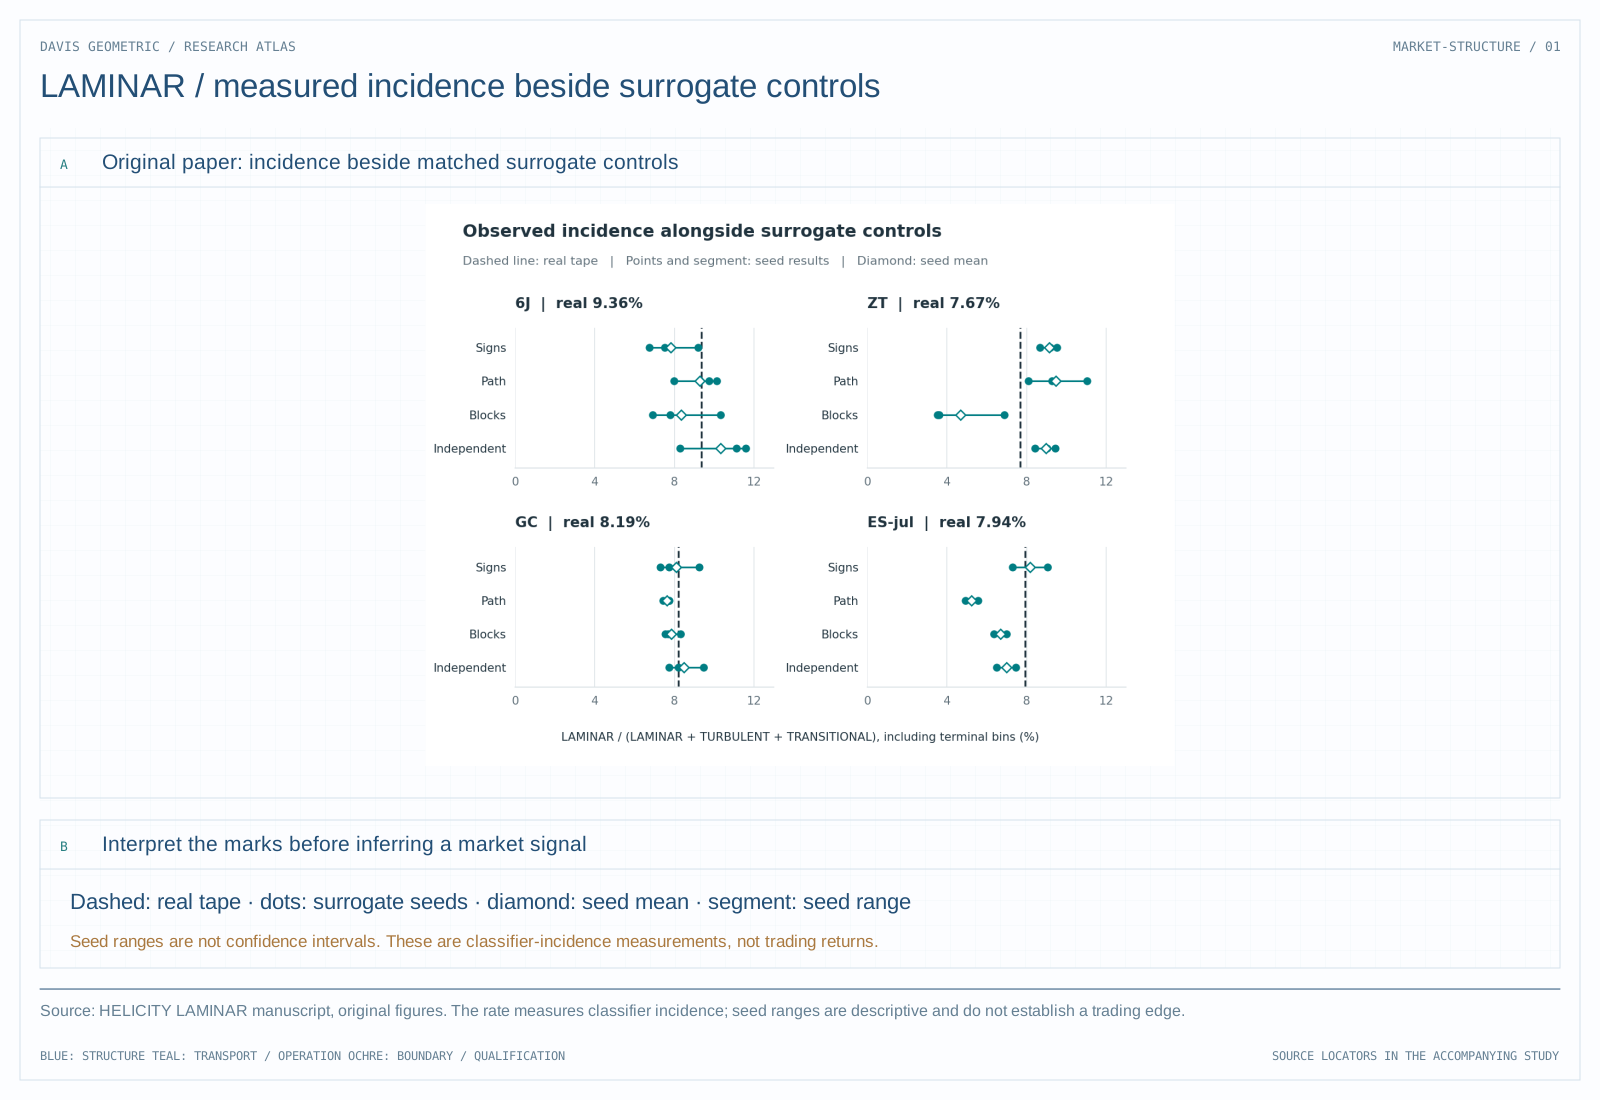
Original LAMINAR manuscript figure. Dashed lines give matched real-input incidence. Dots are seed results, diamonds their means, and segments their ranges—not confidence intervals. There are three surrogate seeds for 6J, ZT and GC, and two for ES. The denominator here includes terminal bins; the sample table below uses the manuscript’s different L + U + R denominator.
03_surrogates.png · Original paper figure; copied without alteration
The measured sample, with both incidence denominators
Scroll horizontally to inspect the full table →
| Tape | Trades | N = L + U + R | L / N (%) | L / (L + U) (%) | Sessions with L / all | 2026 period |
|---|---|---|---|---|---|---|
| RTY | 421,982 | 3,370 | 9.67 | 16.47 | 5/5 | Jul |
| 6E | 133,221 | 3,231 | 8.82 | 14.91 | 5/5 | Jul |
| YM | 277,026 | 3,299 | 8.58 | 15.17 | 5/5 | Jul |
| CL | 3,392,888 | 12,964 | 8.07 | 14.00 | 19/19 | Mar–Apr |
| ZT | 128,267 | 2,976 | 7.90 | 11.60 | 5/5 | Jul |
| NQ | 1,795,518 | 3,385 | 7.68 | 13.18 | 5/5 | Jul |
| GC | 331,552 | 3,377 | 7.67 | 13.45 | 5/5 | Jul |
| 6J | 95,882 | 3,221 | 7.48 | 12.31 | 5/5 | Jul |
| ES | 10,298,409 | 13,303 | 7.35 | 12.50 | 20/20 | Mar–Apr |
| ZB | 144,380 | 2,904 | 7.30 | 9.23 | 5/5 | Jul |
| ZF | 263,750 | 3,060 | 7.06 | 8.90 | 5/5 | Jul |
| ES-apr | 8,887,782 | 13,720 | 7.01 | 11.46 | 20/20 | Apr–May |
| ES-jul | 2,088,165 | 3,385 | 7.00 | 11.62 | 5/5 | Jul |
| ZN-summer | 5,647,076 | 42,144 | 6.73 | 9.20 | 65/65 | Apr–Jul |
| ZN | 2,628,030 | 13,118 | 6.35 | 8.55 | 20/20 | Mar–Apr |
L = LAMINAR, U = TURBULENT, R = TRANSITIONAL. N excludes initializing and separately recorded terminal bins. Conditioning on an asserted regime drops R from the denominator. These are label-incidence measurements, not returns or trading performance.
sample_table.tex · Table tab:sample; all 15 rows
The research in context
Market microstructure studies how individual trades and quotes form prices and liquidity. A recurring question is whether the organization of order flow (which side initiates trades, how trades follow one another, how much the book can absorb) changes before prices do. Measures of that organization are easy to compute and easy to over-read. A diagnostic that fires often may reflect real coordination among traders, or only the mechanics of a threshold set relative to its own recent history. Telling those apart requires controls in which chosen properties of the data are deliberately scrambled while others are kept.
HELICITY consists of a FastAPI backend and a React dashboard working at three scales: macroeconomic FRED series, futures bars, and Databento MBP-10 level-2 book data, with each panel stating whether it runs on live, cached or stored data. An order-flow strategy treats the book as a network and reads its spectral gap, a measure of how quickly the network mixes, together with how self-similar the flow is over time. A blind trial generates twenty labeled synthetic sessions, seals the labels and fixes its scoring hypotheses in source before running. The theory notes' three ECON experiments currently run on generated rather than observed data.
The later LAMINAR working paper measures one label rather than a strategy. It replays licensed CME Globex order-by-order data, 15 tapes covering 12 instruments, 36,533,928 trades and 194 trading-day sessions, through one fixed classifier configuration, recording a state per 120-second bin and keeping transitional readings distinct from turbulent ones. A separate yen experiment of 95,882 trades holds every event fixed and changes only the numerical price scale: in native units every reading is transitional, while reference scaling yields a 7.48 percent laminar rate. Price representation is therefore part of the measurement rather than a formatting detail.
Risk overlay and order-flow measurement are different tasks
The project README describes a risk overlay rather than a directional call. It acknowledges that its own backtests underperformed buy-and-hold on average and distinguishes defensive behavior in falling markets from general outperformance.
The order-flow work examines spectral and temporal structure of the book. Its synthetic blind trial plants a signal in generated sessions; passing that test shows that the implementation responds to the planted structure, not that the same signal produces an edge in real markets.
The later controls change the interpretation
The reviewed LAMINAR manuscript separates label incidence, perturbation sensitivity, and context dependence. In its control grid, independently resampled session marginals produce mean incidence at least as high as the real inputs in three tested instruments. A label appearing often is therefore insufficient evidence of market-specific organization.
The tested S&P session responds more strongly to price-path permutation. Grafted real segments have higher inside-than-outside incidence for some instruments and lower incidence for others. These mixed findings are substantive: the classifier responds to both selected structure and context, rather than identifying one universal flow state.
The next research step
The measurement study should be the representative paper, with returns and execution performance treated as separate downstream questions. Price representation, initialization, withheld labels, and control construction must remain part of each reported incidence.
Background mathematics and definitions
Declare the data level—macroeconomic series, bars, or order-book events—and its timestamp semantics. Construct the graph using only currently available information. Freeze the diagnostic and any decision rule before a chronological holdout.
- Graph edge
- A precisely defined relationship, not an unspecified notion of market similarity.
- Regime score
- A descriptive quantity whose prospective interpretation requires testing.
- Availability time
- The time at which data and any revisions become usable.
Illustrative example
A rolling statistic that includes tomorrow’s revised value is not a valid input for today’s decision. Likewise, a graph built from a full sample can encode future relationships even if the final prediction formula uses only a past timestamp.
This background example is separate from the source records and the main technical figure.
Source record
Additional source versions reviewed
-
helicity/README.mdLocal project manuscript or report · not republished here -
helicity/docs/paper/incidence_of_coherent_order_flow.texLocal project manuscript or report · not republished here
No new experiments are reported in this research note. Figure captions distinguish saved research records, source-model calculations, and explanatory diagrams.